00014890963/312023FYFALSEfalse2,6822,17742964067,45063,9540.0010.001150,000,000150,000,00033,508,07633,364,72233,508,07633,364,7220.0010.00110,000,00010,000,000————nohttp://fasb.org/us-gaap/2022#PropertyPlantAndEquipmentNethttp://fasb.org/us-gaap/2022#PropertyPlantAndEquipmentNethttp://www.thermon.com/20230331#LeaseLiabilityCurrenthttp://www.thermon.com/20230331#LeaseLiabilityCurrenthttp://www.thermon.com/20230331#LeaseLiabilityCurrenthttp://www.thermon.com/20230331#LeaseLiabilityCurrenthttp://www.thermon.com/20230331#LeaseLiabilityNoncurrenthttp://www.thermon.com/20230331#LeaseLiabilityNoncurrenthttp://www.thermon.com/20230331#LeaseLiabilityNoncurrenthttp://www.thermon.com/20230331#LeaseLiabilityNoncurrentone year114296403.753.500014890962022-04-012023-03-3100014890962022-09-30iso4217:USD00014890962023-05-24xbrli:shares00014890962021-04-012022-03-3100014890962020-04-012021-03-31iso4217:USDxbrli:shares00014890962023-03-3100014890962022-03-310001489096us-gaap:CommonStockMember2020-03-310001489096us-gaap:AdditionalPaidInCapitalMember2020-03-310001489096us-gaap:RetainedEarningsMember2020-03-310001489096us-gaap:AccumulatedOtherComprehensiveIncomeMember2020-03-3100014890962020-03-310001489096us-gaap:CommonStockMember2020-04-012021-03-310001489096us-gaap:AdditionalPaidInCapitalMember2020-04-012021-03-310001489096us-gaap:CommonStockMembersrt:DirectorMember2020-04-012021-03-310001489096us-gaap:CommonStockMemberthr:EmployeesMember2020-04-012021-03-310001489096us-gaap:CommonStockMembersrt:ExecutiveOfficerMember2020-04-012021-03-310001489096us-gaap:RetainedEarningsMember2020-04-012021-03-310001489096us-gaap:AccumulatedOtherComprehensiveIncomeMember2020-04-012021-03-310001489096us-gaap:AdditionalPaidInCapitalMember2021-04-012022-03-310001489096us-gaap:CommonStockMember2021-03-310001489096us-gaap:AdditionalPaidInCapitalMember2021-03-310001489096us-gaap:RetainedEarningsMember2021-03-310001489096us-gaap:AccumulatedOtherComprehensiveIncomeMember2021-03-3100014890962021-03-310001489096us-gaap:CommonStockMember2021-04-012022-03-310001489096us-gaap:CommonStockMembersrt:DirectorMember2021-04-012022-03-310001489096us-gaap:CommonStockMemberthr:EmployeesMember2021-04-012022-03-310001489096us-gaap:CommonStockMembersrt:ExecutiveOfficerMember2021-04-012022-03-310001489096us-gaap:RetainedEarningsMember2021-04-012022-03-310001489096us-gaap:AccumulatedOtherComprehensiveIncomeMember2021-04-012022-03-310001489096us-gaap:CommonStockMember2022-03-310001489096us-gaap:AdditionalPaidInCapitalMember2022-03-310001489096us-gaap:RetainedEarningsMember2022-03-310001489096us-gaap:AccumulatedOtherComprehensiveIncomeMember2022-03-310001489096us-gaap:CommonStockMembersrt:DirectorMember2022-04-012023-03-310001489096us-gaap:CommonStockMemberthr:EmployeesMember2022-04-012023-03-310001489096us-gaap:CommonStockMembersrt:ExecutiveOfficerMember2022-04-012023-03-310001489096us-gaap:AdditionalPaidInCapitalMember2022-04-012023-03-310001489096us-gaap:RetainedEarningsMember2022-04-012023-03-310001489096us-gaap:AccumulatedOtherComprehensiveIncomeMember2022-04-012023-03-310001489096us-gaap:CommonStockMember2023-03-310001489096us-gaap:AdditionalPaidInCapitalMember2023-03-310001489096us-gaap:RetainedEarningsMember2023-03-310001489096us-gaap:AccumulatedOtherComprehensiveIncomeMember2023-03-31xbrli:pure0001489096us-gaap:CostOfSalesMember2022-04-012023-03-310001489096us-gaap:CostOfSalesMember2021-04-012022-03-310001489096us-gaap:CostOfSalesMember2020-04-012021-03-310001489096us-gaap:SellingGeneralAndAdministrativeExpensesMember2022-04-012023-03-310001489096us-gaap:SellingGeneralAndAdministrativeExpensesMember2021-04-012022-03-310001489096us-gaap:SellingGeneralAndAdministrativeExpensesMember2020-04-012021-03-310001489096us-gaap:CashAndCashEquivalentsMember2023-03-310001489096us-gaap:CashAndCashEquivalentsMember2022-03-310001489096us-gaap:CashAndCashEquivalentsMember2021-03-310001489096us-gaap:PrepaidExpensesAndOtherCurrentAssetsMember2023-03-310001489096us-gaap:PrepaidExpensesAndOtherCurrentAssetsMember2022-03-310001489096us-gaap:PrepaidExpensesAndOtherCurrentAssetsMember2021-03-310001489096us-gaap:OtherAssetsMember2023-03-310001489096us-gaap:OtherAssetsMember2022-03-310001489096us-gaap:OtherAssetsMember2021-03-310001489096country:RUus-gaap:CashAndCashEquivalentsMember2023-03-312023-03-310001489096us-gaap:BuildingAndBuildingImprovementsMembersrt:MinimumMember2022-04-012023-03-310001489096us-gaap:BuildingAndBuildingImprovementsMembersrt:MaximumMember2022-04-012023-03-310001489096srt:MinimumMemberus-gaap:MachineryAndEquipmentMember2022-04-012023-03-310001489096us-gaap:MachineryAndEquipmentMembersrt:MaximumMember2022-04-012023-03-310001489096us-gaap:FurnitureAndFixturesMembersrt:MinimumMember2022-04-012023-03-310001489096us-gaap:FurnitureAndFixturesMembersrt:MaximumMember2022-04-012023-03-310001489096srt:MinimumMemberus-gaap:SoftwareDevelopmentMember2022-04-012023-03-310001489096us-gaap:SoftwareDevelopmentMembersrt:MaximumMember2022-04-012023-03-3100014890962022-07-012022-09-300001489096thr:PowerblanketMember2022-05-310001489096thr:PowerblanketMember2022-05-312023-03-310001489096thr:PowerblanketMember2022-05-312022-05-3100014890962022-06-012022-06-300001489096thr:PowerblanketMemberus-gaap:SellingGeneralAndAdministrativeExpensesMember2023-03-310001489096thr:PowerblanketMember2023-03-310001489096thr:PowerblanketMemberus-gaap:CustomerRelationshipsMember2022-05-312022-05-310001489096thr:PowerblanketMemberus-gaap:CustomerRelationshipsMember2022-05-310001489096thr:PowerblanketMemberus-gaap:TrademarksMember2022-05-312022-05-310001489096thr:PowerblanketMemberus-gaap:TrademarksMember2022-05-310001489096thr:PowerblanketMemberthr:ContractBasedMember2022-05-312022-05-310001489096thr:PowerblanketMemberthr:ContractBasedMember2022-05-310001489096thr:PowerblanketMemberus-gaap:DevelopedTechnologyRightsMember2022-05-312022-05-310001489096thr:PowerblanketMemberus-gaap:DevelopedTechnologyRightsMember2022-05-310001489096thr:ThermonHeatingSystemsInc.Member2022-04-012023-03-310001489096thr:ThermonHeatingSystemsInc.Member2021-04-012022-03-310001489096thr:ThermonHeatingSystemsInc.Member2020-04-012021-03-310001489096us-gaap:ForeignExchangeForwardMember2023-03-310001489096us-gaap:ForeignExchangeForwardMember2022-03-310001489096us-gaap:FairValueInputsLevel2Memberus-gaap:LoansPayableMember2023-03-310001489096us-gaap:FairValueInputsLevel2Memberus-gaap:LoansPayableMember2022-03-310001489096us-gaap:FairValueInputsLevel2Memberus-gaap:RevolvingCreditFacilityMember2023-03-310001489096us-gaap:FairValueInputsLevel2Memberus-gaap:RevolvingCreditFacilityMember2022-03-310001489096currency:CADus-gaap:ForeignExchangeForwardMember2023-03-310001489096currency:CADus-gaap:ForeignExchangeForwardMember2022-03-310001489096currency:KRWus-gaap:ForeignExchangeForwardMember2023-03-310001489096currency:KRWus-gaap:ForeignExchangeForwardMember2022-03-310001489096us-gaap:ForeignExchangeForwardMembercurrency:AUD2023-03-310001489096us-gaap:ForeignExchangeForwardMembercurrency:AUD2022-03-310001489096currency:GBPus-gaap:ForeignExchangeForwardMember2023-03-310001489096currency:GBPus-gaap:ForeignExchangeForwardMember2022-03-310001489096currency:CNYus-gaap:ForeignExchangeForwardMember2023-03-310001489096currency:CNYus-gaap:ForeignExchangeForwardMember2022-03-310001489096us-gaap:ForeignExchangeForwardMember2022-04-012023-03-310001489096us-gaap:ForeignExchangeForwardMember2021-04-012022-03-310001489096us-gaap:ForeignExchangeForwardMember2020-04-012021-03-310001489096thr:RealPropertyMember2023-03-310001489096us-gaap:EquipmentMembersrt:MinimumMember2023-03-310001489096us-gaap:EquipmentMembersrt:MaximumMember2023-03-310001489096thr:RealPropertyMembersrt:MaximumMember2023-03-310001489096thr:RealPropertyMembersrt:MinimumMember2023-03-310001489096us-gaap:TransferredAtPointInTimeMember2022-04-012023-03-310001489096us-gaap:TransferredAtPointInTimeMember2021-04-012022-03-310001489096us-gaap:TransferredAtPointInTimeMember2020-04-012021-03-310001489096us-gaap:TransferredOverTimeMember2022-04-012023-03-310001489096us-gaap:TransferredOverTimeMember2021-04-012022-03-310001489096us-gaap:TransferredOverTimeMember2020-04-012021-03-3100014890962023-04-012023-03-3100014890962024-04-012023-03-310001489096country:USus-gaap:TransferredAtPointInTimeMember2022-04-012023-03-310001489096country:USus-gaap:TransferredOverTimeMember2022-04-012023-03-310001489096country:US2022-04-012023-03-310001489096us-gaap:TransferredAtPointInTimeMembercountry:CA2022-04-012023-03-310001489096us-gaap:TransferredOverTimeMembercountry:CA2022-04-012023-03-310001489096country:CA2022-04-012023-03-310001489096srt:EuropeMemberus-gaap:TransferredAtPointInTimeMember2022-04-012023-03-310001489096srt:EuropeMemberus-gaap:TransferredOverTimeMember2022-04-012023-03-310001489096srt:EuropeMember2022-04-012023-03-310001489096us-gaap:TransferredAtPointInTimeMembersrt:AsiaMember2022-04-012023-03-310001489096srt:AsiaMemberus-gaap:TransferredOverTimeMember2022-04-012023-03-310001489096srt:AsiaMember2022-04-012023-03-310001489096country:USus-gaap:TransferredAtPointInTimeMember2021-04-012022-03-310001489096country:USus-gaap:TransferredOverTimeMember2021-04-012022-03-310001489096country:US2021-04-012022-03-310001489096us-gaap:TransferredAtPointInTimeMembercountry:CA2021-04-012022-03-310001489096us-gaap:TransferredOverTimeMembercountry:CA2021-04-012022-03-310001489096country:CA2021-04-012022-03-310001489096srt:EuropeMemberus-gaap:TransferredAtPointInTimeMember2021-04-012022-03-310001489096srt:EuropeMemberus-gaap:TransferredOverTimeMember2021-04-012022-03-310001489096srt:EuropeMember2021-04-012022-03-310001489096us-gaap:TransferredAtPointInTimeMembersrt:AsiaMember2021-04-012022-03-310001489096srt:AsiaMemberus-gaap:TransferredOverTimeMember2021-04-012022-03-310001489096srt:AsiaMember2021-04-012022-03-310001489096country:USus-gaap:TransferredAtPointInTimeMember2020-04-012021-03-310001489096country:USus-gaap:TransferredOverTimeMember2020-04-012021-03-310001489096country:US2020-04-012021-03-310001489096us-gaap:TransferredAtPointInTimeMembercountry:CA2020-04-012021-03-310001489096us-gaap:TransferredOverTimeMembercountry:CA2020-04-012021-03-310001489096country:CA2020-04-012021-03-310001489096srt:EuropeMemberus-gaap:TransferredAtPointInTimeMember2020-04-012021-03-310001489096srt:EuropeMemberus-gaap:TransferredOverTimeMember2020-04-012021-03-310001489096srt:EuropeMember2020-04-012021-03-310001489096us-gaap:TransferredAtPointInTimeMembersrt:AsiaMember2020-04-012021-03-310001489096srt:AsiaMemberus-gaap:TransferredOverTimeMember2020-04-012021-03-310001489096srt:AsiaMember2020-04-012021-03-310001489096us-gaap:EmployeeStockOptionMember2022-04-012023-03-310001489096us-gaap:EmployeeStockOptionMember2021-04-012022-03-310001489096us-gaap:EmployeeStockOptionMember2020-04-012021-03-310001489096us-gaap:RestrictedStockUnitsRSUMember2022-04-012023-03-310001489096us-gaap:RestrictedStockUnitsRSUMember2021-04-012022-03-310001489096us-gaap:RestrictedStockUnitsRSUMember2020-04-012021-03-310001489096us-gaap:InventoryValuationReserveMember2021-03-310001489096us-gaap:InventoryValuationReserveMember2021-04-012022-03-310001489096us-gaap:InventoryValuationReserveMember2022-03-310001489096us-gaap:InventoryValuationReserveMember2022-04-012023-03-310001489096us-gaap:InventoryValuationReserveMember2023-03-310001489096country:RUus-gaap:InventoriesMember2022-04-012023-03-310001489096us-gaap:LandBuildingsAndImprovementsMember2023-03-310001489096us-gaap:LandBuildingsAndImprovementsMember2022-03-310001489096us-gaap:MachineryAndEquipmentMember2023-03-310001489096us-gaap:MachineryAndEquipmentMember2022-03-310001489096us-gaap:FurnitureAndFixturesMember2023-03-310001489096us-gaap:FurnitureAndFixturesMember2022-03-310001489096us-gaap:SoftwareDevelopmentMember2023-03-310001489096us-gaap:SoftwareDevelopmentMember2022-03-310001489096us-gaap:ConstructionInProgressMember2023-03-310001489096us-gaap:ConstructionInProgressMember2022-03-310001489096us-gaap:SoftwareDevelopmentMember2021-04-012022-03-310001489096us-gaap:SoftwareDevelopmentMember2020-04-012021-03-310001489096us-gaap:SoftwareDevelopmentMember2022-04-012023-03-310001489096us-gaap:OperatingSegmentsMemberthr:UnitedStatesSegmentMember2021-03-310001489096us-gaap:OperatingSegmentsMemberthr:CanadaSegmentMember2021-03-310001489096us-gaap:OperatingSegmentsMemberthr:EuropeSegmentMember2021-03-310001489096thr:AsiaSegmentMemberus-gaap:OperatingSegmentsMember2021-03-310001489096us-gaap:OperatingSegmentsMember2021-03-310001489096us-gaap:OperatingSegmentsMemberthr:UnitedStatesSegmentMember2021-04-012022-03-310001489096us-gaap:OperatingSegmentsMemberthr:CanadaSegmentMember2021-04-012022-03-310001489096us-gaap:OperatingSegmentsMemberthr:EuropeSegmentMember2021-04-012022-03-310001489096thr:AsiaSegmentMemberus-gaap:OperatingSegmentsMember2021-04-012022-03-310001489096us-gaap:OperatingSegmentsMember2021-04-012022-03-310001489096us-gaap:OperatingSegmentsMemberthr:UnitedStatesSegmentMember2022-03-310001489096us-gaap:OperatingSegmentsMemberthr:CanadaSegmentMember2022-03-310001489096us-gaap:OperatingSegmentsMemberthr:EuropeSegmentMember2022-03-310001489096thr:AsiaSegmentMemberus-gaap:OperatingSegmentsMember2022-03-310001489096us-gaap:OperatingSegmentsMember2022-03-310001489096us-gaap:OperatingSegmentsMemberthr:UnitedStatesSegmentMember2022-04-012023-03-310001489096us-gaap:OperatingSegmentsMemberthr:CanadaSegmentMember2022-04-012023-03-310001489096us-gaap:OperatingSegmentsMemberthr:EuropeSegmentMember2022-04-012023-03-310001489096thr:AsiaSegmentMemberus-gaap:OperatingSegmentsMember2022-04-012023-03-310001489096us-gaap:OperatingSegmentsMember2022-04-012023-03-310001489096us-gaap:OperatingSegmentsMemberthr:UnitedStatesSegmentMember2023-03-310001489096us-gaap:OperatingSegmentsMemberthr:CanadaSegmentMember2023-03-310001489096us-gaap:OperatingSegmentsMemberthr:EuropeSegmentMember2023-03-310001489096thr:AsiaSegmentMemberus-gaap:OperatingSegmentsMember2023-03-310001489096us-gaap:OperatingSegmentsMember2023-03-310001489096thr:ChsTransactionsMemberthr:ProductsIntangiblesMember2023-03-310001489096thr:ChsTransactionsMemberthr:ProductsIntangiblesMember2022-03-310001489096thr:ChsTransactionsMemberus-gaap:TrademarksMember2023-03-310001489096thr:ChsTransactionsMemberus-gaap:TrademarksMember2022-03-310001489096thr:ChsTransactionsMemberus-gaap:DevelopedTechnologyRightsMember2023-03-310001489096thr:ChsTransactionsMemberus-gaap:DevelopedTechnologyRightsMember2022-03-310001489096thr:ChsTransactionsMemberus-gaap:CustomerRelationshipsMember2023-03-310001489096thr:ChsTransactionsMemberus-gaap:CustomerRelationshipsMember2022-03-310001489096thr:ChsTransactionsMemberus-gaap:CertificationMarksMember2023-03-310001489096thr:ChsTransactionsMemberus-gaap:CertificationMarksMember2022-03-310001489096thr:ChsTransactionsMemberus-gaap:OtherIntangibleAssetsMember2023-03-310001489096thr:ChsTransactionsMemberus-gaap:OtherIntangibleAssetsMember2022-03-310001489096thr:ChsTransactionsMember2023-03-310001489096thr:ChsTransactionsMember2022-03-310001489096thr:ChsTransactionsMember2022-04-012023-03-310001489096thr:ChsTransactionsMembersrt:MinimumMemberus-gaap:ProductMember2022-04-012023-03-310001489096thr:ChsTransactionsMemberus-gaap:ProductMembersrt:MaximumMember2022-04-012023-03-310001489096thr:ChsTransactionsMemberus-gaap:DevelopedTechnologyRightsMembersrt:MinimumMember2022-04-012023-03-310001489096thr:ChsTransactionsMemberus-gaap:DevelopedTechnologyRightsMembersrt:MaximumMember2022-04-012023-03-310001489096us-gaap:CustomerRelationshipsMember2022-04-012023-03-310001489096thr:ChsTransactionsMemberus-gaap:CustomerRelationshipsMember2022-04-012023-03-310001489096thr:ChsTransactionsMemberus-gaap:OtherIntangibleAssetsMember2022-04-012023-03-310001489096us-gaap:LoansPayableMember2023-03-310001489096thr:TermLoanADueSeptember2026Member2023-03-310001489096thr:TermLoanADueSeptember2026Member2022-03-310001489096us-gaap:RevolvingCreditFacilityMember2021-09-290001489096thr:USTermLoanMember2021-09-290001489096us-gaap:LineOfCreditMember2021-09-29iso4217:CAD0001489096us-gaap:LineOfCreditMemberthr:January12022ThroughOctober12022Member2021-09-290001489096us-gaap:LineOfCreditMemberthr:January12023ThroughOctober12024Member2021-09-290001489096us-gaap:LineOfCreditMemberthr:January12025ThroughJuly12026Member2021-09-290001489096thr:SecuredOvernightFinancingRateMember2021-09-292021-09-290001489096thr:CDORMember2021-09-292021-09-290001489096us-gaap:RevolvingCreditFacilityMember2021-09-292021-09-290001489096thr:CreditAgreementMember2023-03-310001489096thr:CreditAgreementMember2023-01-012023-03-310001489096us-gaap:RevolvingCreditFacilityMember2023-03-310001489096thr:CanadianTermLoanFacilityMember2023-03-310001489096thr:VariableRateTermLoandueOctober2024Member2023-03-310001489096thr:USRevolvingCreditFacilityMember2023-03-310001489096thr:VariableRateTermLoandueOctober2024Memberus-gaap:LoansPayableMember2023-03-310001489096thr:VariableRateTermLoandueOctober2024Memberus-gaap:LoansPayableMember2022-03-310001489096thr:September302021ThroughSeptember302022Member2023-03-310001489096thr:December312022AndEachFiscalQuarterThereafterMember2023-03-310001489096country:RU2023-01-012023-03-310001489096country:RUus-gaap:CashAndCashEquivalentsMember2022-04-012023-03-310001489096country:RUthr:ContractAssetsMember2023-01-012023-03-310001489096country:RUus-gaap:PrepaidExpensesAndOtherCurrentAssetsMember2022-04-012023-03-310001489096us-gaap:PropertyPlantAndEquipmentMembercountry:RU2022-04-012023-03-310001489096country:RUthr:OperatingLeaseRightOfUseAssetsMember2022-04-012023-03-310001489096us-gaap:OtherNoncurrentAssetsMembercountry:RU2022-04-012023-03-310001489096country:RUus-gaap:LiabilitiesTotalMember2022-04-012023-03-310001489096country:RU2022-04-012023-03-310001489096thr:CanadaSegmentMember2022-04-012023-03-310001489096country:CA2022-04-012022-12-310001489096thr:ThermonSouthAfricaPropriearyLimitedMember2022-04-012023-03-31thr:Positions00014890962020-12-312020-12-310001489096thr:ThermonSouthAfricaPropriearyLimitedMember2020-12-152020-12-1500014890962020-12-152020-12-15iso4217:ZAR0001489096thr:ThermonSouthAfricaPropriearyLimitedMember2020-04-012021-03-310001489096thr:ThermonSouthAfricaPropriearyLimitedMember2021-03-310001489096thr:UnitedStatesAndLatinAmericaSegmentMember2022-04-012023-03-310001489096thr:UnitedStatesAndLatinAmericaSegmentMember2021-04-012022-03-310001489096thr:UnitedStatesAndLatinAmericaSegmentMember2020-04-012021-03-310001489096thr:CanadaSegmentMember2021-04-012022-03-310001489096thr:CanadaSegmentMember2020-04-012021-03-310001489096thr:EuropeMiddleEastAndAfricaSegmentMember2022-04-012023-03-310001489096thr:EuropeMiddleEastAndAfricaSegmentMember2021-04-012022-03-310001489096thr:EuropeMiddleEastAndAfricaSegmentMember2020-04-012021-03-310001489096thr:AsiaPacificSegmentMember2022-04-012023-03-310001489096thr:AsiaPacificSegmentMember2021-04-012022-03-310001489096thr:AsiaPacificSegmentMember2020-04-012021-03-310001489096us-gaap:EmployeeSeveranceMember2021-03-310001489096us-gaap:EmployeeSeveranceMember2021-04-012022-03-310001489096us-gaap:EmployeeSeveranceMember2022-03-310001489096us-gaap:EmployeeSeveranceMember2022-04-012023-03-310001489096us-gaap:EmployeeSeveranceMember2023-03-310001489096thr:RestrictedStockAndStockOptionPlanMember2010-07-280001489096thr:LongTermIncentivePlan2011Member2018-04-010001489096thr:A2020LongTermIncentivePlanMember2023-03-310001489096us-gaap:EmployeeStockOptionMember2022-04-012023-03-310001489096us-gaap:EmployeeStockOptionMember2021-04-012022-03-310001489096us-gaap:EmployeeStockOptionMember2020-04-012021-03-310001489096us-gaap:EmployeeStockOptionMember2023-03-310001489096us-gaap:EmployeeStockOptionMember2020-03-310001489096us-gaap:EmployeeStockOptionMember2021-03-310001489096us-gaap:EmployeeStockOptionMember2022-03-310001489096thr:ExerciseRangeTwoMemberus-gaap:EmployeeStockOptionMember2023-03-310001489096thr:ExerciseRangeTwoMemberus-gaap:EmployeeStockOptionMember2022-04-012023-03-310001489096us-gaap:EmployeeStockOptionMemberthr:ExerciseRangeThreeMember2023-03-310001489096us-gaap:EmployeeStockOptionMemberthr:ExerciseRangeThreeMember2022-04-012023-03-310001489096thr:ExerciseRangeFiveMemberus-gaap:EmployeeStockOptionMember2023-03-310001489096thr:ExerciseRangeFiveMemberus-gaap:EmployeeStockOptionMember2022-04-012023-03-310001489096us-gaap:RestrictedStockUnitsRSUMember2020-03-310001489096us-gaap:RestrictedStockUnitsRSUMember2020-04-012021-03-310001489096us-gaap:RestrictedStockUnitsRSUMember2021-03-310001489096us-gaap:RestrictedStockUnitsRSUMember2021-04-012022-03-310001489096us-gaap:RestrictedStockUnitsRSUMember2022-03-310001489096us-gaap:RestrictedStockUnitsRSUMember2022-04-012023-03-310001489096us-gaap:RestrictedStockUnitsRSUMember2023-03-310001489096srt:ExecutiveOfficerMemberus-gaap:PerformanceSharesMember2022-04-012023-03-310001489096srt:ExecutiveOfficerMemberus-gaap:PerformanceSharesMember2021-04-012022-03-310001489096srt:ExecutiveOfficerMemberus-gaap:PerformanceSharesMember2020-04-012021-03-310001489096us-gaap:PerformanceSharesMember2022-04-012023-03-310001489096us-gaap:PerformanceSharesMember2021-04-012022-03-310001489096us-gaap:PerformanceSharesMember2020-04-012021-03-310001489096us-gaap:PerformanceSharesMembersrt:MinimumMember2022-04-012023-03-310001489096us-gaap:PerformanceSharesMembersrt:MaximumMember2022-04-012023-03-310001489096us-gaap:PerformanceSharesMembersrt:MinimumMember2020-04-012021-03-310001489096us-gaap:PerformanceSharesMembersrt:MaximumMember2020-04-012021-03-310001489096us-gaap:PerformanceSharesMembersrt:MinimumMember2021-04-012022-03-310001489096us-gaap:PerformanceSharesMembersrt:MaximumMember2021-04-012022-03-310001489096us-gaap:DomesticCountryMember2022-04-012023-03-310001489096us-gaap:DomesticCountryMember2021-04-012022-03-310001489096us-gaap:DomesticCountryMember2020-04-012021-03-310001489096us-gaap:ForeignCountryMember2022-04-012023-03-310001489096us-gaap:ForeignCountryMember2021-04-012022-03-310001489096us-gaap:ForeignCountryMember2020-04-012021-03-310001489096thr:OtherliabilitieslongtermMember2022-03-31thr:segmentthr:Geographic_Region0001489096us-gaap:OperatingSegmentsMemberthr:UnitedStatesSegmentMember2020-04-012021-03-310001489096us-gaap:OperatingSegmentsMemberthr:CanadaSegmentMember2020-04-012021-03-310001489096us-gaap:OperatingSegmentsMemberthr:EuropeSegmentMember2020-04-012021-03-310001489096thr:AsiaSegmentMemberus-gaap:OperatingSegmentsMember2020-04-012021-03-310001489096us-gaap:OperatingSegmentsMember2020-04-012021-03-310001489096thr:UnitedStatesSegmentMemberus-gaap:IntersegmentEliminationMember2022-04-012023-03-310001489096thr:UnitedStatesSegmentMemberus-gaap:IntersegmentEliminationMember2021-04-012022-03-310001489096thr:UnitedStatesSegmentMemberus-gaap:IntersegmentEliminationMember2020-04-012021-03-310001489096us-gaap:IntersegmentEliminationMemberthr:CanadaSegmentMember2022-04-012023-03-310001489096us-gaap:IntersegmentEliminationMemberthr:CanadaSegmentMember2021-04-012022-03-310001489096us-gaap:IntersegmentEliminationMemberthr:CanadaSegmentMember2020-04-012021-03-310001489096us-gaap:IntersegmentEliminationMemberthr:EuropeSegmentMember2022-04-012023-03-310001489096us-gaap:IntersegmentEliminationMemberthr:EuropeSegmentMember2021-04-012022-03-310001489096us-gaap:IntersegmentEliminationMemberthr:EuropeSegmentMember2020-04-012021-03-310001489096thr:AsiaSegmentMemberus-gaap:IntersegmentEliminationMember2022-04-012023-03-310001489096thr:AsiaSegmentMemberus-gaap:IntersegmentEliminationMember2021-04-012022-03-310001489096thr:AsiaSegmentMemberus-gaap:IntersegmentEliminationMember2020-04-012021-03-310001489096us-gaap:IntersegmentEliminationMember2022-04-012023-03-310001489096us-gaap:IntersegmentEliminationMember2021-04-012022-03-310001489096us-gaap:IntersegmentEliminationMember2020-04-012021-03-310001489096thr:UnitedStatesSegmentMember2022-04-012023-03-310001489096thr:UnitedStatesSegmentMember2021-04-012022-03-310001489096thr:UnitedStatesSegmentMember2020-04-012021-03-310001489096thr:EuropeSegmentMember2022-04-012023-03-310001489096thr:EuropeSegmentMember2021-04-012022-03-310001489096thr:EuropeSegmentMember2020-04-012021-03-310001489096thr:AsiaSegmentMember2022-04-012023-03-310001489096thr:AsiaSegmentMember2021-04-012022-03-310001489096thr:AsiaSegmentMember2020-04-012021-03-310001489096us-gaap:MaterialReconcilingItemsMember2022-04-012023-03-310001489096us-gaap:MaterialReconcilingItemsMember2021-04-012022-03-310001489096us-gaap:MaterialReconcilingItemsMember2020-04-012021-03-310001489096thr:UnitedStatesSegmentMember2023-03-310001489096thr:UnitedStatesSegmentMember2022-03-310001489096thr:CanadaSegmentMember2023-03-310001489096thr:CanadaSegmentMember2022-03-310001489096thr:EuropeSegmentMember2023-03-310001489096thr:EuropeSegmentMember2022-03-310001489096thr:AsiaSegmentMember2023-03-310001489096thr:AsiaSegmentMember2022-03-31
UNITED STATES
SECURITIES AND EXCHANGE COMMISSION
WASHINGTON, DC 20549
FORM 10-K
☒ ANNUAL REPORT PURSUANT TO SECTION 13 OR 15(d) OF THE SECURITIES EXCHANGE ACT OF 1934
For The Fiscal Year Ended March 31, 2023
or
☐ TRANSITION REPORT PURSUANT TO SECTION 13 OR 15(d) OF THE SECURITIES EXCHANGE ACT OF 1934
For the transition period from to
Commission File Number: 001-35159
THERMON GROUP HOLDINGS, INC.
(Exact name of registrant as specified in its charter)
| | | | | | | | | | | | | | | | | | | | |
| Delaware | | | | | | 27-2228185 |
| (State or other jurisdiction of incorporation or organization) | | | | | | (I.R.S. Employer Identification No.)
|
| 7171 Southwest Parkway, | Building 300, | Suite 200, | Austin, | Texas | | 78735 |
(Address of principal executive offices) | | | | | | (Zip Code) |
(512) 690-0600
(Registrant's telephone number, including area code)
Securities registered pursuant to Section 12(b) of the Act:
| | | | | | | | | | | | | | |
| Title of each class | | Trading Symbol(s) | | Name of each exchange
on which registered |
| Common Stock, $0.001 par value per share | | THR | | New York Stock Exchange |
Securities registered pursuant to Section 12(g) of the Act: None
Indicate by check mark if the registrant is a well-known seasoned issuer, as defined in Rule 405 of the Securities Act. ¨ Yes x No
Indicate by check mark if the registrant is not required to file reports pursuant to Section 13 or Section 15(d) of the Act. ¨ Yes x No
Indicate by check mark whether the registrant (1) has filed all reports required to be filed by Section 13 or 15(d) of the Securities Exchange Act of 1934 during the preceding 12 months (or for such shorter period that the registrant was required to file such reports), and (2) has been subject to such filing requirements for the past 90 days. x Yes ¨ No
Indicate by check mark whether the registrant has submitted electronically every Interactive Data File required to be submitted pursuant to Rule 405 of Regulation S-T (§ 232.405 of this chapter) during the preceding 12 months (or for such shorter period that the registrant was required to submit such files). x Yes ¨ No
Indicate by check mark whether the registrant is a large accelerated filer, an accelerated filer, a non-accelerated filer, a smaller reporting company, or an emerging growth company. See the definitions of "large accelerated filer," "accelerated filer," "smaller reporting company," and "emerging growth company" in Rule 12b-2 of the Exchange Act.
| | | | | | | | | | | | | | |
Large accelerated filer | o | | Accelerated filer | x
|
| Non-accelerated filer | o | | Smaller reporting company | ☐ |
| | | Emerging growth company | ☐ |
If an emerging growth company, indicate by check mark if the registrant has elected not to use the extended transition period for complying with any new or revised financial accounting standards provided pursuant to Section 13(a) of the Exchange Act. ¨
Indicate by check mark whether the registrant has filed a report on and attestation to its management’s assessment of the effectiveness of its internal control over financial reporting under Section 404(b) of the Sarbanes-Oxley Act (15 U.S.C.7262(b)) by the registered public accounting firm that prepared or issued its audit report. ☒
If securities are registered pursuant to Section 12(b) of the Act, indicate by check mark whether the financial statements of the registrant included in the filing reflect the correction of an error to previously issued financial statements.¨
Indicate by check mark whether any of those error corrections are restatements that required a recovery analysis of incentive-based compensation received by any of the registrant’s executive officers during the relevant recovery period pursuant
to §240.10D-1(b). ¨
Indicate by check mark whether the registrant is a shell company (as defined in Rule 12b-2 of the Exchange Act). ☐ Yes x No
The aggregate market value of the registrant's common equity held by non-affiliates as of September 30, 2022, was $506,846,812 based on the closing price of $15.41 as reported on the New York Stock Exchange. Solely for the purposes of this calculation, directors and officers of the registrant are deemed to be affiliates.
As of May 24, 2023, the registrant had 33,513,794 shares of common stock, par value $0.001 per share, outstanding.
DOCUMENTS INCORPORATED BY REFERENCE
As permitted by General Instruction G of Form 10-K, certain portions, as expressly described in this report, of the registrant's Definitive Proxy Statement for the 2023 Annual Meeting of Stockholders to be filed with the SEC are incorporated by reference into Part III of this Annual Report on Form 10-K.
THERMON GROUP HOLDINGS, INC.
ANNUAL REPORT
FOR THE FISCAL YEAR ENDED MARCH 31, 2023
TABLE OF CONTENTS
| | | | | |
| | Page |
| PART I | |
| |
| |
| |
| |
| |
| |
| |
| |
| PART II | |
| |
| |
| |
| |
| |
| |
| |
| |
| |
| |
| |
| PART III | |
| |
| |
| |
| |
| |
| |
| |
| PART IV | |
| |
| |
| |
| |
| |
| |
FORWARD-LOOKING STATEMENTS
This Annual Report on Form 10-K ("this annual report") includes forward-looking statements within the meaning of the U.S. federal securities laws in addition to historical information. These forward-looking statements are made pursuant to the safe harbor provisions of the Private Securities Litigation Reform Act of 1995. These forward-looking statements are included throughout this annual report, including in the sections entitled "Risk Factors," "Management's Discussion and Analysis of Financial Condition and Results of Operations" and "Business" and include, without limitation, statements regarding our industry, business strategy, plans, goals and expectations concerning our market position, future operations, margins, profitability, capital expenditures, liquidity and capital resources and other financial and operating information. When used in this discussion, the words "anticipate," "assume," "believe," "budget," "continue," "contemplate," "could," "should," "estimate," "expect," "intend," "may," "plan," "possible," "potential," "predict," "project," "will," "would," "future" and similar terms and phrases are intended to identify forward-looking statements in this annual report.
Forward-looking statements reflect our current expectations regarding future events, results or outcomes. These expectations may or may not be realized. Some of these expectations may be based upon assumptions, data or judgments that prove to be incorrect. In addition, our business and operations involve numerous risks and uncertainties, many of which are beyond our control, which could result in our expectations not being realized or otherwise materially affect our financial condition, results of operations and cash flows. The statements include but are not limited to statements regarding: (i) our plans to strategically pursue emerging growth opportunities in diverse regions and across industry sectors; (ii) our plans to secure more new facility project bids; (iii) our ability to generate more facility maintenance, repair and operations or upgrades or expansions revenue from our existing and future installed base; (iv) our ability to timely deliver backlog; (v) our ability to respond to new market developments and technological advances; (vi) our expectations regarding energy consumption and demand in the future and its impact on our future results of operations; (vii) our plans to develop strategic alliances with major customers and suppliers; (viii) our expectations that our revenues will increase; (ix) our belief in the sufficiency of our cash flows to meet our needs for the next year; (x) our ability to integrate acquired companies; (xi) our ability to successfully achieve synergies from acquisitions; and (xii) our ability to make required debt repayments.
Actual events, results and outcomes may differ materially from our expectations due to a variety of factors. Although it is not possible to identify all of these factors, they include, among others, (i) general economic conditions and cyclicality in the markets we serve; (ii) future growth of energy, chemical processing and power generation capital investments; (iii) our ability to operate successfully in foreign countries; (iv) the outbreak of a global pandemic, including the current pandemic (COVID-19 and its variants); (v) our ability to successfully develop and improve our products and successfully implement new technologies; (vi) competition from various other sources providing similar heat tracing and process heating products and services, or alternative technologies, to customers; (vii) our ability to deliver existing orders within our backlog; (viii) our ability to bid and win new contracts; (ix) the imposition of certain operating and financial restrictions contained in our debt agreements; (x) our revenue mix; (xi) our ability to grow through strategic acquisitions; (xii) our ability to manage risk through insurance against potential liabilities (xiii) changes in relevant currency exchange rates; (xiv) tax liabilities and changes to tax policy; (xv) impairment of goodwill and other intangible assets; (xvi) our ability to attract and retain qualified management and employees, particularly in our overseas markets; (xvii) our ability to protect our trade secrets; (xviii) our ability to protect our intellectual property; (xix) our ability to protect data and thwart potential cyber-attacks; (xx) a material disruption at any of our manufacturing facilities; (xxi) our dependence on subcontractors and third-party suppliers; (xxii) our ability to profit on fixed-price contracts; (xxiii) the credit risk associated to our extension of credit to customers; (xxiv) our ability to achieve our operational initiatives; (xxv) unforeseen difficulties with expansions, relocations, or consolidations of existing facilities; (xxvi) potential liability related to our products as well as the delivery of products and services; (xxvii) our ability to comply with foreign anti-corruption laws; (xxviii) export control regulations or sanctions; (xxix) changes in government administrative policy; (xxx) the current geopolitical instability in Russia and Ukraine and related sanctions by the U.S. and Canadian governments and European Union; (xxxi) environmental and health and safety laws and regulations as well as environmental liabilities; and (xxxii) climate change and related regulation of greenhouse gases. Any one of these factors or a combination of these factors could materially affect our future results of operations and could influence whether any forward-looking statements contained in this annual report ultimately prove to be accurate. See also Item 1A, "Risk Factors" for information regarding the additional factors that have impacted or may impact our business and operations.
Our forward-looking statements are not guarantees of future performance, and actual results and future performance may differ materially from those suggested in any forward-looking statements. We do not intend to update these statements unless we are required to do so under applicable securities laws.
PART I
References in this annual report to "we," "our," "us," the "Company," or "Thermon" mean Thermon Group Holdings, Inc. and its consolidated subsidiaries taken together as a combined entity. A particular fiscal year is the twelve months ended on March 31 of the given calendar year (e.g., "fiscal 2023," "fiscal 2022" and "fiscal 2021" relate to the Company's fiscal years ended March 31, 2023, March 31, 2022, and March 31, 2021, respectively). Thermon Group Holdings, Inc. is a holding company that conducts all its business through its subsidiaries, and its common stock is listed on the New York Stock Exchange under the symbol "THR."
ITEM 1. BUSINESS
Business Overview
We are one of the largest providers of highly engineered industrial process heating solutions for process industries. For over 65 years, we have served a diverse base of thousands of customers around the world in attractive and growing markets, including chemical and petrochemical, oil, gas, power generation, commercial, rail and transit, and other, which we refer to as our "key end markets." We offer a full suite of products (heating units, heating cables, tubing bundles, heated blankets, and temporary power solutions), services (engineering, installation and maintenance services) and software (design optimization and wireless and network control systems) required to deliver comprehensive solutions to some of the world's largest and most complex projects. With a legacy of innovation and continued investment in research and development, Thermon has established itself as a technology leader in hazardous or classified areas, and we are committed to developing sustainable solutions for our customers. We serve our customers through a global network of sales and service professionals and distributors in more than 30 countries and through our nine manufacturing facilities on two continents. These global capabilities and longstanding relationships with some of the largest multinational oil, gas, chemical processing, power and engineering, procurement and construction ("EPC") companies in the world have enabled us to diversify our revenue streams and opportunistically access high-growth markets worldwide.
Thermon, Inc., our principal operating subsidiary in the United States, was founded as a partnership in October 1954 and later incorporated in Texas in 1960. At that time, our primary product was a thermally conductive heat transfer compound invented by our founder, Richard Burdick. Under Mr. Burdick's leadership, we experienced steady growth by diversifying our products and expanding our geographic reach. Mr. Burdick and his family maintained a controlling interest in us until August 2007, when the controlling interest was sold to an affiliate of the Audax Group private equity firm.
Our corporate offices are located at 7171 Southwest Parkway, Building 300, Suite 200, Austin, Texas 78735. Our telephone number is (512) 690-0600. Our website address is www.thermon.com. Copies of the charters of the committees of our board of directors, our code of business conduct and ethics and our corporate governance guidelines are available free of charge on our Investor Relations website located at http://ir.thermon.com. All reports that we have filed with the Securities and Exchange Commission ("SEC"), including this Annual Report on Form 10-K and our Current Reports on Form 8-K, can be obtained free of charge from the SEC's website at www.sec.gov or through our Investor Relations website. In addition, all reports filed with the SEC may be read and copied at the SEC's Public Reference Room at 100 F Street, NE, Washington, D.C. 20549-1090. Information regarding the operation of the public reference room may be obtained by calling the SEC at 1-800-SEC-0330. None of the information on our website or any other website identified herein is incorporated by reference in this annual report and should not be considered a part of this annual report.
Sales
Heat Tracing
We offer turnkey heat tracing solutions for maintaining pipe, vessel, and foundation temperatures in industrial and hazardous locations as well as in commercial applications. Our solution includes software automated engineering design services, industry leading heat tracing products, smart connected control and monitoring systems, construction services, and maintenance services. Applications include process temperature maintenance, freeze protection, vessel temperature maintenance, tank temperature maintenance, and foundation heating for energy, commercial, transportation, semi-conductor, data centers, and food & beverage industries.
Our tubing bundle solutions include bundle design services, heated and insulated sample lines for process control and instrumentation, and continuous emissions sampling lines for regulatory required environmental emissions monitoring and enforcement. We believe this capability allows us to offer products which help our customers with important sustainability practices, such as measuring emissions and complying with related regulatory requirements.
Our temporary power systems provide portable, flexible, and hazardous area rated electrical connection systems and LED lighting that provide the power infrastructure for workers in construction zones and projects for industrial plants and facilities.
Our heated blankets are built upon patented heat spreading technology and we also offer portable industrial chillers. We are a leading expert in temperature control that provides patented standard and custom-made heating products, world-class industrial chillers and cooling wraps, and we operate an industrial heating e-commerce website.
Our products and services include a wide range of electric heat tracing cables, steam heating solutions, controls, monitoring and software, instrumentation, project services, industrial heating and filtration solutions, temporary electrical power distribution and lighting, and other complementary products and services.
Controls, Monitoring and Software
Our solutions include smart, connected devices and software systems for the control and management of a customer’s heat trace system. We offer a range of Genesis™ and TraceNet™ control products from a single point controller to a high-capacity multi-point control panel. All our controllers and panels can be networked together via wired or wireless communication into a large control solution with capacity to manage over 30,000 heat trace circuits within the same customer facility. Our systems can be integrated with a plant’s central data management and control system. Advanced control systems enable lower cost and reduced emissions at many of our end-user sites.
Our controls and plant management software are built upon internet of things (IOT) technology that can be deployed locally within the secure plant environment. Our smart devices utilize the latest touch technology and industry leading intuitive user interfaces. Users familiar with modern mobile phones and tablets find our latest controllers intuitive to learn and use because of the similarities. These technologies also form a platform for offering easy automatic upgrades and additional value-added services. We believe our control solutions are the most advanced, reliable and easy-to-use monitoring solutions in the marketplace.
Process Heating
Thermon Heating Systems, or "THS," develops, designs and manufactures the following high quality and durable advanced industrial heating and filtration solutions, including the following categories:
•Environmental heating (branded as "Ruffneck," "Norsemen," and "Catadyne") - provides electric or gas-powered space heating for both hazardous and non-hazardous areas;
•Process heating (branded as "Caloritech") - provides highly engineered heating products to multiple end-markets with the purpose of heating and maintaining a process fluid at specified temperatures. Some products also serve the transportation sector with both radiant and convection-style heating;
•Filtration (branded as "3L Filters") - provides highly specialized filtration solutions for the most stringent environments, including the nuclear industry; and
•Rail and Transit (branded as "Hellfire," "Velocity," "ArcticSense" and others) - provides heating applications to both rolling stock (rail cars) and rail infrastructure (track and switch).
Project Services
As a manufacturer and global expert in process heating solutions, our EPC and end-user customers often rely on Thermon to deliver a range of project services, which may include:
•Engineering and design;
•Procurement and project management services;
•Turnkey construction installation;
•Recurring facility assessment or audit; and
•Maintenance services.
Our customers rely on Thermon’s design and engineering expertise on projects around the world. These services are combined with our heat tracing and process heating products under one contract to deliver an integrated solution that improves the overall value proposition for the customer. By delivering design drawings in conjunction with early project specifications, we can address our customer needs for design optimization studies, product selection assistance and computer-generated drawing packages. Often these are new facilities (which are discussed further below under the section "Customers"), but they may also include upgrades or expansions and maintenance projects where our existing customers are upgrading their facilities. Project services are important to our business model and growth strategy to secure contracts that both establish and enhance new and existing customer relationships.
Our services are automated by custom software technology. We have invested over years to develop software that assists our experts in the design, specification, and automatic creation of CAD drawings. Our project engineering staff empowered with this software technology can execute the largest projects, including the creation of thousands of drawings, accurately and with efficiency that cannot be matched by manpower alone.
Project services also include full turnkey solutions whereby we contract to install a complete heat tracing or process heating solution. We refer to this as our construction business which is primarily located in the southern United States near many of our customers in the downstream and mid-stream petroleum, chemical and power generation industries.
Manufacturing and Operations
We have nine manufacturing facilities and two smaller assembly facilities, which complement our manufacturing operations. Most of our heat tracing products are manufactured in our facility in San Marcos, Texas, including flexible heating cables, control systems and tubing bundles. Process Heating products are primarily manufactured at our Canadian facilities. We have smaller manufacturing locations in Salt Lake City, Utah, the Netherlands, and we have small assembly operations in Pune, India and Houston, Texas. We maintain a high level of operational efficiency and excellent quality standards in all our manufacturing facilities through the use of automated processes and rigorous quality control checkpoints and procedures.
Our San Marcos, Texas operation includes an Electron Cross-Linking Facility that is used to stabilize the resin material in our low-temperature self-regulating heating cables. Ownership of this operation allows us to have complete control of the manufacturing process, enhancing quality and reducing the lead time by about six weeks. Some of the base heating cable that is produced in San Marcos is shipped to our different sites to reduce lead time and to satisfy local content requirements.
Pre-insulated tubing products are manufactured in our facilities in San Marcos, Texas and Pijnacker, the Netherlands and are primarily made to the individual customer’s specifications. The process includes application of a thermal insulation over one or more process tubes, along with an electric heat trace cable or steam heating tube, and a protective plastic outer jacket that is extruded onto the bundle to protect the insulation.
Our process heating solutions are manufactured in various plants in Canada. The Edmonton facility largely manufactures environmental heating products. The Orillia facility manufactures tubular heaters, including our mineral insulated ("MI") heating cable that is supplied to OEM customers and other Thermon facilities. The Oakville location specializes in our engineered solutions and our Calgary facility fabricates electric heat trace circuits using the MI cable produced in Orillia. Thermon Power Solutions is a product line that provides temporary power distribution and lighting products that are primarily fabricated at a facility in Fort McMurray, Alberta, Canada.
Thermon transportation heating products are assembled at our facilities in Edmonton, Alberta and Denver, Colorado. We are also expanding assembly capabilities at our San Marcos, Texas facility. This includes both solutions for rail car heating and rail track heating.
Our heated blankets and certain chiller blankets and related products are manufactured and shipped at our Salt Lake City, Utah facility, which also serves as our headquarters for the recently acquired Powerblanket brand.
Our primary distribution centers are located in San Marcos, Texas; Calgary, Alberta; and Pijnacker, the Netherlands. Inventory is typically shipped from these distribution centers directly to customers, the construction site or our regional sales agents or distributors. Our sales agents may maintain "safety stocks" of core products to service the immediate maintenance and repair requirements of customers who are time-sensitive and cannot wait for delivery from one of the central distribution centers. In the United States, a network of representatives maintain safety stocks of core products. In Canada, customers are serviced from the five manufacturing locations in Calgary, Edmonton, Fort McMurray, Orillia and Oakville. In Europe, customers are serviced from the central distribution center in the Netherlands. In Asia, safety stock of materials are kept in Yokohama, Japan; Seoul, Korea; Shanghai, China; Pune, India; and Melbourne, Australia. Safety stocks are also warehoused in Mexico City, Mexico. Thermon aims to have inventory available close to the customer to fulfill urgent needs.
Customers
We serve a broad base of large multinational customers, many of which we have served for more than 65 years. We have a diversified revenue mix with thousands of customers. None of our customers represented more than 10% of total revenue in fiscal 2023, 2022, or 2021.
Marketing
Our direct sales force is focused on positioning us with major end-users and EPC companies during the development phase of large projects with the goal of providing reliable, cost-effective process heating solutions. We utilize a network of more than 100 independent sales agents and distributors in over 30 countries to provide local support to customer facilities for maintenance, repairs and upgrades. In addition to focused EPC sales, Thermon is actively engaged in commercial strategies to address a diversified mix of customers in our key end markets. Revenue diversification is a key long-term strategic initiative for the business. We believe that we have established our credibility as a reliable provider of high-quality process heating products. In addition, we believe that our registered trademarks in the United States and numerous additional brand names are recognized globally, giving us excellent brand recognition.
Standards and Certifications
Thermon’s research and development practices ensure our product designs are validated to market requirements and verified to comply with applicable industry standards. We actively participate in the growth and development of the domestic and international electrical standards established in the countries in which we sell products. We continually test our products through a quality control process to demonstrate they can withstand harsh operating environments. They are subjected to various tests, including heat output, thermal stability and long-term aging, with the goal of producing products capable of performing at or beyond the expectations of our customers. All products are further tested and certified for global use by various approval agencies, such as UL, CSA, FM, and ETL, to meet industry leading international standards.
In order to support the design and development of industrial products rated for operation in potentially hazardous environments, Thermon holds quality system approvals which employ the appropriate oversight requirements. To support the international business, Thermon is audited annually by an Ex Certification Body such as DEKRA, and we hold a Quality Assurance Notification and Quality Assurance Report to IEC/ISO 80079-34. To support the North American business, Thermon is audited quarterly by many nationally recognized test labs including but not limited to UL, CSA, FM, and ETL, to OSHA and Standards Council of Canada requirements. In addition, Thermon also pursues various regional and maritime certifications such as DNV, ABS, EAC, KOSHA and many more. In addition, all of our manufacturing facilities are ISO 9001 certified, which allows us to continue to produce safe, reliable products certified for operating in potentially hazardous environments.
Over the last three decades, Thermon has made significant investments to actively participate in standardization at the national and international level. We are active in several committees such as the National Electrical Code (NEC), Canadian Electrical Code (CEC), American National Standards Institute (ANSI), National Electrical Equipment Manufacturers Association (NEMA), and the International Electrotechnical Commission (IEC). We leverage our extensive expertise and knowledge in industrial process heating technology to continually improve the applicable standards of our industry.
Markets
The major end markets that drive demand for process heating include chemical and petrochemical, up-, mid- and downstream oil, gas, power generation, commercial and rail and transit. We believe there are attractive long-term trends in each of these end markets. In addition, our products are increasingly being leveraged in energy transition markets as industry looks to electrification as a means of decarbonizing operations. The primary energy transition end markets and applications include, but are not limited to, biofuels, hydrogen, thermal energy storage, and carbon capture.
•Chemical and Petrochemical. Process heating is required for temperature maintenance and freeze protection in a variety of chemical processing applications. Factors that may impact process heating demand in chemical and petrochemical end markets include the rapid industrialization of the developing world, a shift in base chemical
processing operations to low-cost feedstock regions, a transition of Western chemical processing activities from commodity products to specialty products and environmental compliance.
•Gas. Process heating is in the production and transmission of gas in upstream, midstream, and downstream applications. Despite recent market volatility, gas markets have remained resilient over the last twelve months, especially as a feedstock for petrochemical plants, and represent a significant and growing addressable market for our value-added solutions. This includes the global and growing market for liquefied natural gas (LNG) compression and regasification facilities, which has been accelerated by the war in Ukraine and the resulting need for Europe to reduce reliance on Russian oil and gas.
•Oil. Process heating is used to facilitate the exploration, production, processing, transportation and distribution of oil and oil-based energy products in upstream, midstream, and downstream oil applications. While the demand forecast for oil can be unpredictable, we have a sizable installed base that provides recurring revenue, especially in the downstream refining market.
•Power Generation. Process heating is required for high-temperature product maintenance, freeze protection and environmental regulation compliance in coal and gas facilities and for safety systems in nuclear facilities. An important driver of demand for process heating solutions for power generation is increasing demand for electricity worldwide, with an increasing prevalence of renewable power generation solutions.
•Rail and Transit. Process heating is required to safely clear and heat rail switches, melt snow and ice from platforms, and provide comfort heating and defrosting in rolling stock. With over 1.1 million kilometers of operational railway in the world, rail is still one of the most economical and safe solutions for passengers and products globally.
•Commercial. Process heating is required for hospitals, hospitality/lodging, universities and secondary education, and light industrial facilities to provide freeze protection, temperature regulation, process control, and supporting laboratory environments. The electrification of heating products and removal of combustion-based heating solutions in urban areas drives demand for our products.
•Energy Transition/Decarbonization. Regulatory and societal pressures and cost competitiveness are increasingly leading our customers to invest in decarbonization technologies that help reduce their carbon emissions. Electrification of process heating is a trend we are benefiting from across all of our existing end markets noted above, and the adoption of new technologies is providing additional opportunities in new end markets. Examples include, but are not limited to, biofuels, hydrogen, thermal energy storage, and carbon capture. The primary drivers for our existing products are the direct electrification of carbon-intensive products, the reduction of greenhouse gas emissions, and more competitive total installed cost.
•General Industries and Other. We serve a growing number of other markets where we add value for customers, such as mining and mineral processing, maritime/shipbuilding, semiconductors, pharmaceutical and biotechnology, food and beverage, data centers, and renewables.
Our ability to provide technology design, such as wireless network controls and design software is an increasing factor in our customers' decision to purchase our products.
Segments
We operate in four reportable segments based on four geographic countries or regions in which we operate: (i) United States and Latin America ("US-LAM"), (ii) Canada, (iii) Europe, Middle East and Africa ("EMEA") and (iv) Asia-Pacific ("APAC"). Profitability within our segments is measured by operating income. See Note 19, "Segment Information" for financial data relating to our four reportable geographic segments.
Competition
The global industrial electric heat tracing industry is fragmented and consists of more than 30 companies, which typically only serve discrete local markets and provide a limited-service offering. We believe that we are the second largest participant in the industrial electric heat tracing market and one of only a few solution providers with a comprehensive suite of products and services, global capabilities, and industry-leading controls technology, which includes our design software products. Our most significant competitor is the thermal management segment of nVent Electric plc (NYSE: NVT).
The industrial process heating market, which includes industrial heat tracing, tends to be fairly fragmented with several smaller companies serving discrete local markets with limited offerings. Our competitors vary by end-market, but generally we view nVent Electric, NIBE, Watlow and Spirax Sarco as competitors in various areas across the spectrum of end-markets we serve.
Industrial process heating providers differentiate themselves through value-added services, long-term customer relationship management and the ability to provide a full range of solutions. We differentiate ourselves from local providers by
maintaining a global footprint, a full suite of products and services and a track record with some of the largest multinational energy, chemical processing, power and EPC companies in the world. In addition, we are almost entirely dedicated to providing thermal solutions and complementary products and services whereas some of our competitors' thermal solutions operations constitute only one of numerous operating segments.
Intellectual Property and Technology
The industrial process heating industry, as well as the complementary markets where we intend to expand, are highly competitive and subject to the introduction of innovative techniques and services using new technologies. While we have patented some of our products and processes, we historically have not relied upon patents to protect our design, manufacturing processes or products, and our patents are not material to our operations or business. Instead, we rely significantly on maintaining the confidentiality of our trade secrets, manufacturing know-how, other proprietary rights and other information related to our operations. Accordingly, we require all employees to sign a nondisclosure agreement to protect our trade secrets, business strategy and other proprietary information. We rely on registered and unregistered trademarks in the United States and abroad and have many recognized brand names.
Our research and development activities are focused on identifying new technologies to enhance our industrial process heating solutions and meet the evolving needs of our customers. This maximizes safety and product reliability and reduces the customer's total cost of ownership, which consists of capital expenses, maintenance costs and energy costs. Current product development initiatives include polymer research and continued advancement of integrated control and monitoring systems. Software development activities include advanced heat tracing network monitoring communication software and engineering design software initiatives.
Resources
Our critical raw materials include polymers, graphite, copper and stainless steel. For most of these materials, we purchase from multiple suppliers to avoid any potential disruption of our manufacturing operations. For a small number of raw material items that require specific quality specifications, we have single source supply arrangements. We manage the inherent supply risk through purchase contracts and increased safety stock levels. We evaluate pricing and performance of all suppliers annually. For our low volume custom-built electronic controller components, we select a single supplier based on past performance reliability and closely monitor the process as volumes are too low to divide this product over multiple suppliers. More than half of the components we purchase by cost are off-the-shelf items and are readily available from multiple sources. Our purchase specifications are usually based on industry or manufacturer standards. Testing of the raw materials is performed and documented by our suppliers and is reviewed by us at the time of receipt. While our manufacturing locations are predominantly in North America, we operate an “in the region, for the region” strategy to diversify our supplier base, manage costs and hold inventory across our various sites. We employ a screening mechanism for conflict materials as part of our supplier approval and management processes. Use of tin, tungsten, tantalum and gold (3TG) in our purchased components is minimal. We have established a process to collect and report conflict minerals use in order to meet all regulatory and customer requirements. We use limited amounts of magnesium, graphite and platinum in our processes and these commodities are sourced from multiple suppliers to ensure availability. The quantities we consume of these materials are insignificant compared to the global production and usage.
Government Contracts
We do not have any material portion of our business that may be subject to renegotiation of profits or termination of contracts or subcontracts at the U.S. government's election.
Government Regulation
Due to the international scope of our operations, we are subject to complex United States and foreign laws governing, among others, anti-corruption matters, export controls, economic sanctions, anti-boycott rules, currency exchange controls and transfer pricing rules. These laws are administered by, among others, the U.S. Department of Justice, the SEC, the Internal Revenue Service, or the "IRS," Customs and Border Protection, the Bureau of Industry and Security, or "BIS," the Office of Antiboycott Compliance, or "OAC," and the Office of Foreign Assets Control, or "OFAC," as well as the counterparts of these agencies in foreign countries. Our policies mandate compliance with all applicable laws and regulations, including the recent economic sanctions. Despite our training and compliance programs, no assurances can be made that we will be found to be operating in full compliance with, or be able to detect every violation of, any such laws. We cannot predict the nature, scope or effect of future regulatory requirements to which our international operations might be subject or the manner in which existing laws might be administered or interpreted.
In addition, our operations and properties are subject to a variety of federal, state, local and foreign environmental laws and regulations, including those governing the discharge of pollutants into the air or water, the management and disposal of hazardous substances or wastes, the cleanup of contaminated sites, the emission of greenhouse gases, and workplace health and safety. Certain environmental laws, including the Comprehensive Environmental Response, Compensation, and Liability Act, impose joint and several liability for cleanup costs, without regard to fault, on persons who have disposed of or released
hazardous substances into the environment. In addition, we could become liable to third parties for damages resulting from the disposal or release of hazardous substances into the environment. Some of our sites are affected by soil and groundwater contamination relating to historical site operations, which could require us to incur expenses to investigate and remediate the contamination in compliance with environmental laws. Some of our operations require environmental permits and controls to prevent and reduce air and water pollution, and these permits are subject to modification, renewal and revocation by issuing authorities. A failure to obtain, maintain, and comply with these permit requirements could result in substantial penalties, including facility shutdowns. From time to time, we could be subject to requests for information, notices of violation, and/or investigations initiated by environmental regulatory agencies relating to our operations and properties. Violations of environmental and health and safety laws can result in substantial penalties, civil and criminal sanctions, permit revocations, and facility shutdowns. Environmental and health and safety laws may change rapidly and have tended to become more stringent over time. As a result, we could incur costs for past, present, or future failure to comply with all environmental and health and safety laws and regulations. In addition, we could become subject to potential regulations concerning the emission of greenhouse gasses or the disclosure thereof, and while the effect of such future regulations cannot be determined at this time, they could require us to incur substantial costs in order to achieve and maintain compliance. In the ordinary course of business, we may be held responsible for any environmental damages we may cause to our customers' premises.
Other than our compliance requirements with environmental regulations, compliance with other government regulations has not had, and based on laws and regulations currently in effect, is not expected to have a material effect on the Company's capital expenditures, earnings or competitive position. See the section titled Item 1A, "Risk Factors" for additional information on government regulation that could impact our business.
Human Capital Management
We believe that our people are one of our most important investments and greatest assets. The success and growth of our business depend on our ability to attract, develop, incent and retain a diverse population of talented, qualified and highly skilled employees at all levels of our organization, including our executive officers, and across our global workforce. Our culture enables us to achieve our vision to be the world leader in industrial process heating. At the heart of our culture are our core values of Care, Commit and Collaborate.
Our board of directors provides important oversight on certain human capital matters through its Human Capital Management and Compensation Committee (the "HCMC Committee"). The HCMC Committee maintains oversight over our strategic direction for various people-related business strategies, including our compensation and benefit programs, leadership succession planning, culture, diversity, equity and inclusion, and talent development programs. The Company’s management proactively manages our human capital and cares for our employees in a manner that is consistent with our values.
Employee Health and Safety
We believe nothing is more important than the health, safety, and well-being of our people. We work hard to achieve best in class levels of safety through the application of policies and best practices. We maintain a robust safety culture to reduce workplace injuries, supported by effective communication, reporting, and external benchmarking. We hold regular talks and events on key safety topics, including reporting all injuries, hazards, near-misses, and case management to prevent recurrence. We also participate in industry groups, within and outside the manufacturing, construction, and energy sectors, to share safety best practices and collaborate to address safety concerns.
Our Safety Record
Any loss of life or serious injury in the workplace is unacceptable. We did not have any fatal incidents at any of our facilities or job sites in fiscal 2023. We primarily track two key safety indicators in monitoring our safety efforts, total recordable incident rate (“TRIR”) and lost-time incident rate (“LTIR”). Our TRIR increased from 0.3 in fiscal 2022 to 0.4 in fiscal 2023 and our LTIR increased from 0.0 to 0.1 in the same periods. TRIR and LTIR are defined as the Company’s number of recordable injuries/loss time, respectively, experienced by employees during the fiscal year multiplied by 200,000 divided by the number of man hours worked during the fiscal year.
In addition to TRIR and LTIR, we also measure total near miss and hazard ID reporting as well as case management metrics. These aid in accident prevention, which we believe is critical to incident avoidance and supports our superior safety rating in the industry.
Workforce Breakdown
At March 31, 2023, we employed 1,405 employees, of which 42.3% were located in the US-LAM, 36.8% in Canada, 9.1% located in EMEA, and 11.7% located in APAC. We also contracted with 131 contingent workers at March 31, 2023. Our 12-month rolling voluntary turnover rate as of March 31, 2023, was 17.7% compared to the 2022 U.S. manufacturing industry average of 27.7% according to the U.S. Bureau of Labor Statistics ("BLS") Job Openings and Labor Turnover Survey. Our fiscal year differs from the period covered by the BLS study, but we believe it is the best proxy to benchmark against. We are committed to reducing our voluntary turnover. Approximately 0.3% of our global employees are covered by a collective
bargaining agreement. We have not experienced any union-related work stoppages in the past, and we believe that our working relationship with our employees is positive.
Diversity, Equity, and Inclusion
We believe in the benefits of an inclusive workforce, where diverse backgrounds are represented, engaged, and empowered to inspire innovative ideas and decisions. We have locations in 15 countries, and our employees operate across cultures, functions, unique languages, and time zones to solve the technical and logistical challenges presented by a worldwide customer base. Our diversity statistics include the following as of March 31, 2023, (based on self-reporting at the date of hire): 25.6% of our employees worldwide identify as female; 25.9% of our employees in the U.S. identify as female, and 48.1% of our employees in the U.S. identify as a racial or ethnic minority.
In fiscal 2023, we expanded diversity metrics already in place that directly affect the short-term incentive payments for Vice Presidents, in addition to our executive officers. These metrics are specific to our U.S. and Canadian salaried workforce and include increasing diversity in candidate interview slates; decreasing new hire turnover of diverse talents; and increasing overall diversity.
We know we have more to do when it comes to increasing the representation of historically underrepresented groups within our global workforce, and we are taking action to ensure Thermon is an employer of choice for diverse candidates.
Talent Development
The Company supports and invests in talent development and provides continuing education opportunities and professional development for our employees. We use a robust performance management by objective process that identifies goals and reinforces the Company's values through an evaluation process twice per year. Furthermore, the ‘Level Up’ job structure for direct labor employees yielded a number of promotions which is key to the upskilling of our workforce and aided in the retention of our workforce.
Compensation and Benefits
We provide competitive compensation and benefits programs to help meet the needs of our employees and to attract and retain talent. In addition to salaries, all regular full and part-time employees globally have an opportunity to earn an annual short-term incentive. Benefits vary by country and region, but our U.S. and Canadian employees have a retirement plan, healthcare and insurance benefits, health savings and flexible spending accounts, paid time off, flexible work schedules (where appropriate), employee assistance programs, tuition assistance, and scholarship programs for children and grandchildren of employees.
In addition to our broad-based programs, we use targeted equity-based grants with vesting conditions to facilitate retention of key personnel, particularly those with critical domain expertise necessary to deliver on the long-term strategic initiatives of the Company.
Employee Retention
Thermon was impacted by the post-pandemic-era trend of voluntary employee departures. In the U.S. alone, more than four million people left their jobs each month in calendar year 2022 according to the U.S. Bureau of Labor Statistics. Thermon’s global voluntary turnover in fiscal 2023 was up 10.7% over the prior year. As a result, the Company implemented new strategies to improve retention and career satisfaction. These strategies included improvements in direct labor and research & development wages and benefits, targeted compensation pools, and career path development for direct labor and our accounting department.
Seasonality
Demand for our products depends in large part upon the level of capital and maintenance expenditures by many of our customers and end-users, in particular those customers in the oil, gas, refining, chemical processing and transportation markets. These customers' expenditures historically have been cyclical in nature and vulnerable to economic downturns. In addition, quarterly revenues for the heat tracing business are impacted by the significance and timing of large projects that may occur at any given time.
Our quarterly operating results may fluctuate based on the cyclical pattern of industries to which we provide heat tracing solutions and the seasonality of demand for our heat tracing products. Most of our heat tracing customers perform preventative maintenance prior to the winter season, typically making our second and third fiscal quarters the largest for related revenue. However, revenues from projects are not seasonal and depend on the capital spending environment and project timing. Our operating expenses remain relatively consistent with some variability related to the overall headcount of the Company.
Our revenue derived from industrial process heating products typically experiences more pronounced seasonality than our legacy heat tracing business, with a noticeable increase in revenue and profitability typically beginning in the third fiscal quarter and continuing during the winter months through the end of the fourth fiscal quarter.
ITEM 1A. Risk Factors
The following risk factors address the material risks concerning our business. If any of the risks discussed in this annual report were to occur, our business, prospects, financial condition, results of operations and our ability to service our debt could be materially and adversely affected and the trading price of our common stock could decline significantly. Some statements in this annual report, including statements in the following risk factors, constitute forward-looking statements. Please refer to the section entitled "Forward-Looking Statements."
Risks Related to Our Business and Industry
Macroeconomic and Industry Risks
The markets we serve are subject to general economic conditions and cyclical demand, which could harm our business and lead to significant shifts in our results of operations from quarter to quarter that make it difficult to project long-term performance.
Our operating results have been and may in the future be adversely affected by general economic conditions and the cyclical pattern of certain industries in which our customers and end-users operate. Demand for our products and services depends in large part upon the level of capital and maintenance expenditures by many of our customers and end-users, in particular those in the energy, chemical processing and power generation industries, and firms that design and construct facilities for these industries. These customers' expenditures historically have been cyclical in nature and vulnerable to economic downturns. Prolonged periods of little or no economic growth could decrease demand for oil and gas which, in turn, could result in lower demand for our products and a negative impact on our results of operations and cash flows. In addition, this historically cyclical demand may lead to significant shifts in our results of operations from quarter to quarter, which limits our ability to make accurate long-term predictions about our future performance.
Suspensions and delays in large capital projects within the energy sector, especially in the United States and Canada, have adversely affected our results of operations in recent years. Continued significant volatility in the energy industry could further decrease demand for some of our products and services and adversely affect our business, financial condition and results of operations.
A significant portion of our revenue historically has been generated by end-users in the oil and gas markets where we serve all three major categories of customers in the petroleum industry - upstream exploration/production, midstream transportation and downstream refining. The businesses of most of our customers in the energy industry are, to varying degrees, cyclical and historically have experienced periodic downturns. Profitability in the energy industry is highly sensitive to supply and demand cycles and commodity prices, which historically have been volatile, and our customers in this industry have tended to delay large capital projects, including expensive maintenance and upgrades, during industry downturns. Customer project delays and cancellations may limit our ability to realize value from our backlog as expected and cause fluctuations in the timing or the amount of revenue earned and the profitability of our business in a particular period. In addition, such delays and cancellations may lead to significant fluctuations in results of operations from quarter to quarter, making it difficult to predict our financial performance on a quarterly basis.
Demand for a significant portion of our products and services depends upon the level of capital expenditure by companies in the energy industry, which depends, in part, on energy prices, which can be volatile. In recent years, we have experienced suspensions or delays in large capital projects within the energy sector, especially in the upstream exploration and production sector, and most notably in the United States and Canada. The impact on oil and gas commodity markets has further been impacted by the Russo-Ukrainian war. A sustained downturn in the capital expenditures of our customers, whether due to the significant volatility in the market price of oil and gas or demand for oil and gas products, may delay projects, decrease demand for our products and services, which, in turn, could have an adverse effect on our business, financial condition and results of operations. Such volatility, including the perception that it might continue, could also have a significant negative impact on the market price of our common stock.
As a global business, we are exposed to economic, political and other risks in a number of countries, which could materially reduce our revenues, profitability, cash flows, or materially increase our liabilities. If we are unable to continue operating successfully in one or more foreign countries, it may have an adverse effect on our business and financial condition.
For fiscal 2023, approximately 56% of our revenues were generated outside of the United States, and approximately 21% were generated outside of North America. One of our key growth strategies is to continue to expand our global footprint in emerging and high growth markets around the world; however, we may be unsuccessful in expanding our international business.
Conducting business outside the U.S. subjects us to additional risks that may impact our revenues, profitability or cash flows or increase our liabilities, including the following:
•changes in a specific country's or region's political, social or economic conditions, particularly in emerging markets;
•changes in trade relations between the United States, Canada or Europe and foreign countries in which our customers and suppliers operate, including protectionist measures such as tariffs, import or export licensing requirements and trade sanctions;
•restrictions on our ability to own or operate subsidiaries in, expand in and, if necessary, repatriate cash from, foreign jurisdictions;
•exchange controls and currency restrictions;
•the burden of complying with numerous and potentially conflicting legal requirements;
•potentially negative consequences from changes in U.S. and foreign tax laws;
•difficulty in staffing and managing (including ensuring compliance with internal policies and controls) geographically widespread operations;
•different regulatory regimes controlling the protection of our intellectual property;
•difficulty in the enforcement of contractual obligations in non-U.S. jurisdictions and the collection of accounts receivable from foreign accounts; and
•transportation delays or interruptions.
One or more of these factors could prevent us from successfully expanding our presence in international markets, could have an adverse effect on our revenues, profitability or cash flows or cause an increase in our liabilities. We may not succeed in developing and implementing policies and strategies to counter the foregoing factors effectively in each location where we do business. In addition, the imposition of trade restrictions, economic sanctions or embargoes by the United States or foreign governments could adversely affect our future sales and results of operations.
The outbreak of a global pandemic, such as the pandemic caused by the novel strain of coronavirus (COVID-19) and its variants, and the measures taken in response thereto could have an adverse effect on our business, results of operations and financial condition.
Our business, financial condition, results of operations and cash flows may be adversely affected if a global pandemic, including the COVID-19 pandemic and its variants, interferes with the ability of our employees, vendors and customers to perform our and their respective responsibilities and obligations relative to the conduct of our business. The COVID-19 pandemic has caused significant volatility in the global economy. Public health problems resulting from COVID-19 and safety measures instituted by governments and businesses to mitigate its spread, including travel restrictions and quarantines, have contributed to a general slowdown in the global economy, adversely impacted the businesses of our customers, suppliers and distribution partners, and disrupted our operations, and may continue to do so on an ongoing basis. For example, precautionary measures instituted by government authorities and sanitization procedures adopted to protect our employees in response to the COVID-19 pandemic required us to temporarily suspend operations at certain of our sales offices and manufacturing facilities during the initial onset of the COVID-19 pandemic in 2020.
Changes in our operations around the world in response to a global pandemic or employee illnesses resulting therefrom may result in inefficiencies or delays, including delays in sales and product development efforts, delays to our strategic plans, and additional costs related to business continuity initiatives, that cannot be fully mitigated through succession planning, employees working remotely or teleconferencing technologies. In addition, changes in the operations of our suppliers in response to a pandemic may also result in disruptions in our manufacturing and supply arrangements caused by the loss or disruption of essential manufacturing and supply elements such as raw materials or other finished product components, transportation, workforce or other manufacturing and distribution capability. Finally, a pandemic could negatively affect our internal controls over financial reporting as a portion of our workforce is required to work from home, potentially requiring new processes, procedures, and controls.
An economic downturn due to a global pandemic has in the past resulted, and could in the future result in reduced demand for our products and services. The severity and longevity of such pandemic may cause customers to suspend their decisions on using our products and/or services and give rise to significant changes in regional and global economic conditions that could delay or interfere with the capital spending of our customers, which could have a material impact on our consolidated business, results of operations and financial condition in our fiscal year ending March 31, 2023 and beyond. A global pandemic could also have the effect of heightening other risks described elsewhere in these Risk Factors.
Business Risks
If we are unable to successfully develop and improve our products and successfully implement new technologies in the markets that we serve and develop solutions for diversified new markets, our business and results of operations could be adversely affected.
Our future success will depend upon our continued investment in research and development of new products, improvement and enhancement of our existing product offerings and our ability to continue to achieve new technological advances in the process heating industry. Our inability to continue to successfully develop and market new products or our inability to implement technological advances on a pace consistent with that of our competitors could adversely affect our business and results of operations.
We may be unable to compete successfully in the highly competitive markets in which we operate.
We operate in domestic and international markets and compete with highly competitive domestic and international manufacturers and service providers. The fragmented nature of the process heating industry and the similarly fragmented nature of the industrial process heating industry makes the market for our products and services highly competitive. A number of our direct and indirect competitors are major multinational corporations, some of which have substantially greater technical, financial and marketing resources, and additional competitors may enter these markets at any time. In addition, we compete against many regional and lower-cost manufacturers. Our competitors may develop products that are superior to our products, develop methods of more efficiently and effectively providing products and services, adapt more quickly than we do to new technologies or evolving customer requirements, or attempt to compete based primarily on price, localized expertise and local relationships. If we are unable to continue to differentiate our products and services or if we experience an increase in competition, it may cause us to lose market share or compel us to reduce prices to remain competitive, which could result in a reduction in our revenues and results of operations.
Our backlog may fluctuate and a failure to deliver our backlog on time could affect our future sales, profitability and our relationships with our customers, and if we were to experience a material amount of modifications or cancellations of orders, our sales could be negatively impacted.
Our backlog is comprised of the portion of firm signed purchase orders or other written contractual commitments received from customers that we have not recognized as revenue. Backlog may increase or decrease based on the addition of large multi-year projects and their subsequent completion. Backlog may also be favorably or unfavorably affected by foreign currency rate fluctuations. The dollar amount of backlog as of March 31, 2023 was $163.3 million. The timing of our recognition of revenue out of our backlog is subject to a variety of factors that may cause delays, many of which, including fluctuations in our customers' delivery schedules, are beyond our control and difficult to forecast. Such delays may lead to significant fluctuations in results of operations from quarter to quarter, making it difficult to predict our financial performance on a quarterly basis. Further, while we have historically experienced few order cancellations and the amount of order cancellations has not been material compared to our total contract volume, if we were to experience a significant amount of cancellations of or reductions in purchase orders, it would reduce our backlog and, consequently, our future sales and results of operations.
Our ability to meet customer delivery schedules for our backlog is dependent on a number of factors including, but not limited to, access to raw materials, an adequate and capable workforce, engineering expertise for certain projects, sufficient manufacturing capacity and, in some cases, our reliance on subcontractors. The availability of these factors may in some cases be subject to conditions outside of our control. A failure to deliver in accordance with our performance obligations may result in financial penalties and damage to existing customer relationships, our reputation and a loss of future bidding opportunities, which could cause the loss of future business and could negatively impact our future sales and results of operations.
Our future revenue depends in part on our ability to bid and win new contracts. Our failure to effectively obtain future contracts could adversely affect our profitability.
Our future revenue and overall results of operations require us to successfully bid on new contracts and, in particular, contracts for large projects, which are frequently subject to competitive bidding processes. Our revenue from major projects depends in part on the level of capital expenditures in our principal end markets, including the energy, chemical processing and power generation industries. If we fail to replace completed or canceled large projects with new order volume of the same magnitude, our backlog will decrease and our future revenue and financial results may be adversely affected. The number of such projects we win in any year fluctuates, and is dependent upon the number of projects available and our ability to bid successfully for such projects. Contract proposals and negotiations are complex and frequently involve a lengthy bidding and selection process, which is affected by a number of factors, such as competitive position, market conditions, financing arrangements and required governmental approvals. For example, a client may require us to provide a bond or letter of credit to protect the client should we fail to perform under the terms of the contract. If we fail to secure adequate financial arrangements or required governmental approvals, we may not be able to pursue particular projects, which could adversely affect our profitability.
Our current or future indebtedness could impair our financial condition and reduce the funds available to us for other purposes. Our debt agreements impose certain operating and financial restrictions, with which failure to comply could result in an event of default that could adversely affect our results of operations.
We have substantial indebtedness. At March 31, 2023, we had $98.4 million of outstanding indebtedness. If our cash flows and capital resources are insufficient to fund the interest payments on our outstanding borrowings under our credit facility and other debt service obligations and keep us in compliance with the covenants under our debt agreements or to fund our other liquidity needs, we may be forced to reduce or delay capital expenditures, sell assets or operations, seek additional capital or restructure or refinance our indebtedness. We cannot guarantee that we would be able to (i) take any of these actions or that these actions would permit us to meet our scheduled debt service obligations or that these actions would be permitted under the terms of our existing or future debt agreements, which may impose significant operating and financial restrictions on us and could adversely affect our ability to finance our future operations or capital needs; (ii) obtain standby letters of credit, bank guarantees or performance bonds required to bid on or secure certain customer contracts; (iii) make strategic acquisitions or investments or enter into alliances; (iv) withstand a future downturn in our business or the economy in general; (v) engage in business activities, including future opportunities, that may be in our interest; and (vi) plan for or react to market conditions or otherwise execute our business strategies.
If we cannot make scheduled payments on our debt, or if we breach any of the covenants in our debt agreements, we will be in default under such agreements and, as a result, our debt holders could declare all outstanding principal and interest to be due and payable, the lenders under our credit facility could terminate their commitments to lend us money and foreclose against the assets securing our borrowings, and we could be forced into bankruptcy or liquidation.
In addition, we and certain of our subsidiaries may incur significant additional indebtedness, including additional secured indebtedness. Although the terms of our debt agreements contain restrictions on the incurrence of additional indebtedness, these restrictions are subject to a number of qualifications and exceptions, and additional indebtedness incurred in compliance with these restrictions could be significant. Incurring additional indebtedness could increase the risks associated with our substantial indebtedness, which may impact our ability to meet our debt service obligations.
Our gross margins depend, in part, on our revenue mix. Although large project revenues, which provide for an ongoing stream of future high-margin revenues, are critical to our success and growth, increased large project revenues can adversely affect our gross margin.
Typically, both large project and maintenance customers require our products as well as our engineering and construction services. We tend to experience lower margins from our design optimization, engineering, installation and maintenance services than we do from sales of our heating cable, tubing bundle and control system products. We also tend to experience lower margins from our outsourced products, such as electrical switch gears and transformers, than we do from our manufactured products. Accordingly, our gross margins are impacted by our mix of products and services. Although our product mix varies from period to period due to a variety of factors, during fiscal year ended March 31, 2023, project-related revenue accounted for approximately 37% of our total revenue. Although project revenues, which provide for an ongoing stream of future high-margin maintenance revenues, are critical to our long-term success and growth, a revenue mix higher in lower-margin project revenues relative to historical levels could adversely affect our gross margins and results of operations.
Our business strategy includes growth and product diversification through strategic acquisitions. These acquisitions and investments could be unsuccessful or consume significant resources, which could adversely affect our results of operations.
Acquisitions and investments may involve cash expenditures, debt incurrence, operating losses and expenses that could have an adverse effect on our financial condition and results of operations. Acquisitions involve numerous other risks, including:
•diversion of management time and attention from daily operations;
•difficulties integrating acquired businesses, technologies and personnel into our business;
•difficulties in realization of expected synergies and revenue creation or cross-selling opportunities;
•potential loss of key employees, key contractual relationships or key customers of acquired companies or of us; and
•assumption of the liabilities and exposure to unforeseen liabilities of acquired companies.
We have limited experience in acquiring or integrating other businesses or making investments or undertaking joint ventures with others. It may be difficult for us to complete transactions quickly and to integrate acquired operations efficiently into our current business operations. It may also be difficult for us to identify suitable acquisition candidates, which may inhibit our growth rate. Any acquisitions or investments may ultimately harm our business or financial condition if they are unsuccessful and any acquisitions or investments ultimately result in impairment charges.
We carry insurance against many potential liabilities, but our management of risk may leave us exposed to unidentified or unanticipated risks.
Although we maintain insurance policies with respect to our related exposures, including certain casualty, property and business interruption programs, these policies contain deductibles, self-insured retentions and limits of coverage. In addition,
we may not be able to continue to obtain insurance at commercially reasonable rates or may be faced with liabilities not covered by insurance, such as, but not limited to, environmental contamination, conflicts, or terrorist attacks. We estimate our liabilities for known claims and unpaid claims and expenses based on information available as well as projections for claims incurred but not reported. However, insurance liabilities, some of which are self-insured, are difficult to estimate due to various factors. If any of our insurance policies or programs are not effective in mitigating our risks, we may incur losses that are not covered by our insurance policies, that are subject to deductibles or that exceed our estimated accruals or our insurance policy limits, which could adversely impact our business and results of operations.
Volatility in currency exchange rates may adversely affect our financial condition, results of operations or cash flows.
We may not be able to effectively manage our exchange rate and/or currency transaction risks. Volatility in currency exchange rates may decrease our revenue and profitability, adversely affect our liquidity and impair our financial condition. While we have entered into hedging instruments to manage our exchange rate risk as it relates to certain intercompany balances with certain of our foreign subsidiaries, these hedging activities do not eliminate exchange rate risk, nor do they reduce risk associated with total foreign sales. In addition, we may not be able to obtain hedging instruments with respect to certain currencies. For example, we were unable to renew our foreign currency hedges in respect of the Russian Ruble in light of the Russo-Ukrainian war and related sanctions imposed by the United States and European Union.
Our non-U.S. subsidiaries generally sell their products and services in the local currency, but obtain a significant amount of their products from our facilities located elsewhere, primarily the United States, Canada or Europe. In particular, significant fluctuations in the Canadian Dollar, the Russian Ruble, the Euro or the Pound Sterling against the U.S. Dollar could adversely affect our results of operations. During fiscal 2023, the value of the U.S. Dollar overall strengthened in relation to the principal non-U.S. currencies from which we derive revenue, which negatively impacted revenue by $15.1 million. During fiscal 2022, the value of the U.S. Dollar overall weakened in relation to the principal non-U.S. currencies from which we derive revenue, which positively impacted revenue by $5.9 million. Any further appreciation in the U.S. Dollar relative to such non-U.S. currencies could continue to have a significant negative impact on our results of operations in future periods. We also bid for certain foreign projects in U.S. Dollars or Euros. If the U.S. Dollar or Euro strengthen relative to the value of the local currency, we may be less competitive in bidding for those projects. In addition, currency variations can adversely affect margins on sales of our products in countries outside of the U.S. and margins on sales of products that include components obtained from suppliers located outside of the U.S. See Item 7A, "Quantitative and Qualitative Disclosures about Market Risk" for additional information regarding our foreign currency exposure relating to operations.
Because our consolidated financial results are reported in U.S. Dollars and we generate a substantial amount of our sales and earnings in other currencies, the translation of those results into U.S. Dollars can result in a significant decrease in the amount of those sales and earnings. Fluctuations in currencies relative to the U.S. Dollar may make it more difficult to perform period-to-period comparisons of our reported results of operations. In addition, the net asset values of foreign operations are adjusted upward and downward based on currency exchange rate fluctuations and are reported in our foreign currency translation adjustment as part of other comprehensive income in our consolidated statements of operations and comprehensive income/(loss).
Additional liabilities related to taxes, potential tax adjustments or changes to tax policy in foreign jurisdictions could adversely impact our financial results, financial condition and cash flows.
We are subject to tax and related obligations in the jurisdictions in which we operate or do business, including state, local, federal and foreign taxes. The taxing laws of the various jurisdictions in which we operate or do business often are complex and subject to varying interpretations. Tax authorities may challenge tax positions that we take or historically have taken, and may assess taxes where we have not made tax filings or may audit the tax filings we have made and assess additional taxes, as they have done from time to time. Some of these assessments may be substantial, and may involve the imposition of substantial penalties and interest. Significant judgment is required in evaluating our tax positions and in establishing appropriate reserves. The resolutions of our tax positions are unpredictable. The payment of substantial additional taxes, penalties or interest resulting from any assessments could adversely impact our results of operations, financial condition and cash flows.
We have significant goodwill and other intangible assets and future impairment of our goodwill and other intangible assets could have a material negative impact on our financial results.
We test goodwill and indefinite-life intangible assets for impairment on an annual basis, and more frequently if circumstances warrant, by comparing the estimated fair value of each of our reporting units to their respective carrying values. As of March 31, 2023, our goodwill and other intangible assets balance was $313.6 million, which represented 48% of our total assets. Long-term declines in projected future cash flows could result in future goodwill and other intangible asset impairments. Because of the significance of our goodwill and other intangible assets, any future impairment of these assets could have a material adverse effect on our financial results.
If we lose our senior management or other key employees or cannot successfully execute succession plans, our business may be adversely affected.
Competition for qualified management and key technical and sales personnel in our industry is intense. Our ability to successfully operate and grow our global business and implement our strategies is largely dependent on the efforts, abilities and services of our senior management and other key employees. If we lose the services of our senior management or other key employees for any reason and are unable to timely find and secure qualified replacements with comparable experience in the industry, our business could be negatively affected.
We rely heavily on trade secrets to gain a competitive advantage in the market and the unenforceability of our nondisclosure agreements may adversely affect our operations.
The process heating industry is highly competitive and subject to the introduction of innovative techniques and services using new technologies. We rely significantly on maintaining the confidentiality of our trade secrets and other information related to our operations. Accordingly, we require all employees to sign a nondisclosure agreement to protect our trade secrets, business strategy and other proprietary information. If the provisions of these agreements are found unenforceable in any jurisdiction in which we operate, the disclosure of our proprietary information may place us at a competitive disadvantage. Even where the provisions are enforceable, the confidentiality clauses may not provide adequate protection of our trade secrets and proprietary information in every such jurisdiction and our trade secrets and proprietary information could be compromised as a result.
Intellectual property challenges may hinder our ability to develop, engineer and market our products, and we may incur significant costs in our efforts to successfully avoid, manage, defend and litigate intellectual property matters.
Patents, non-compete agreements, proprietary technologies, trade secrets, customer relationships, trademarks, trade names and brand names are important to our business. Intellectual property protection, however, may not preclude competitors from developing products similar to ours or from challenging our trade names or products. Our pending patent applications and our pending copyright and trademark registration applications may not be allowed or competitors may challenge the validity or scope of our patents, copyrights or trademarks. In addition, our patents, copyrights, trademarks and other intellectual property rights may not provide us a significant competitive advantage, particularly in those countries where the laws do not protect our intellectual property rights as fully as in the United States. Participants in our markets may use challenges to intellectual property as a means to compete. Patent and trademark challenges increase our costs to develop, engineer and market our products. We may need to spend significant resources monitoring our intellectual property rights and we may or may not be able to detect infringement by third parties. If we fail to successfully enforce our intellectual property rights or register new patents, our competitive position could suffer, which could have a material adverse effect on our business, financial condition, results of operations and cash flows.
In addition, any dispute or litigation involving intellectual property could be costly and time-consuming due to the complexity and the uncertainty of intellectual property litigation. Our intellectual property portfolio may not be useful in asserting a counterclaim, or negotiating a license, in response to a claim of infringement or misappropriation. In addition, as a result of such claims, we may lose our rights to utilize critical technology, may be required to pay substantial damages or license fees with respect to the infringed rights or may be required to redesign our products at a substantial cost, any of which could have a material adverse effect on our business, financial condition, results of operations and cash flows.
Operational Risks
Breaches of our information technology systems could occur that materially damage business partner and customer relations and subject us to significant reputational, financial, legal and operational consequences.
As a company we store company, customer, employee and business partner information, which may include, among other information, trade secrets, names, addresses, phone numbers, email addresses, tax identification numbers, payment account information and customer facility information. We could be subject to sophisticated and targeted attacks attempting to obtain unauthorized access to confidential information, destroy data, disrupt or degrade service, sabotage systems or cause other damage, including via the introduction of computer viruses or malware and cyber-attacks. These attacks are constantly evolving in nature, increasing the efforts and controls required to prevent, detect and defend against them. We require user names and passwords as well as multi-factor authentication ("MFA") in order to access our information technology systems. These security measures are subject to potential third-party security breaches, employee error, malfeasance and faulty password management, among other limitations. Third parties may attempt to fraudulently induce employees or customers into disclosing user names, passwords or other sensitive information, which may in turn be used to access our information technology systems. We may not be able to anticipate, detect or recognize threats to our system or to implement effective preventive measures against all security breaches. If we were to experience a breach of our systems and were unable to protect sensitive data, such a breach could, among other things:
•risk exposing our confidential manufacturing processes and other trade secreted information that may lead to new and increased entrants and competitors in our business or cause other damage to the business;
•expose our customers' facilities and projects to increased safety and security risk;
•materially damage business partner and customer relationships;
•impact our reputation in the markets in which we compete for business;
•adversely impact our financial results and expose us to potential risk of loss or litigation; and/or
•require us to incur substantial costs or require us to change our business practices.
A material disruption at any of our manufacturing facilities could adversely affect our financial performance and results of operations.
If operations at any of our manufacturing facilities were to be disrupted as a result of significant equipment failures, natural disasters, pandemics, power outages, fires, explosions, terrorism, adverse weather conditions, labor disputes or other reasons, we may be unable to fill customer orders and meet customer demand for our products, which could adversely affect our financial performance and results of operations. For example, our marketing and research & development buildings, located on the same campus as our former corporate headquarters and primary manufacturing facility in San Marcos, Texas, were destroyed by a tornado in January 2007. In addition, during fiscal 2021 and 2022, precautionary measures instituted by government authorities in certain markets and sanitization procedures adopted to protect our employees in response to the COVID-19 pandemic have required us to temporarily suspend operations at certain of our manufacturing facilities.
Interruptions in production, in particular at our manufacturing facilities in the United States or Canada, at which we manufacture the majority of our products, could increase our costs and reduce our sales. Any interruption in production capability could require us to make substantial capital expenditures to fill customer orders, which could negatively affect our profitability and financial condition. We maintain property damage insurance that we believe to be adequate to provide for reconstruction of facilities and equipment, as well as business interruption insurance to mitigate losses resulting from any production interruption or shutdown caused by an insured loss. However, any recovery under our insurance policies may not offset the lost sales or increased costs that may be experienced during the disruption of operations, which could adversely affect our financial performance and results of operations.
Our dependence on subcontractors and third-party suppliers could adversely affect our results of operations.
We often rely on third-party subcontractors, suppliers and manufacturers to produce our products and complete our projects. To the extent we cannot engage subcontractors or acquire supplies or raw materials from third parties, our ability to produce our products or complete our projects in a timely fashion or at a profit may be impaired. If the amount we are required to pay for these goods and services exceeds the amount we have estimated in bidding for fixed-price contracts, we could experience losses on these contracts. In addition, if a subcontractor or supplier is unable to deliver its services or materials according to the negotiated contract terms for any reason, including the deterioration of its financial condition or over-commitment of its resources, we may be required to purchase the services or materials from another source at a higher price or, if unavailable, limit the availability of products critical to our operations. Such shortages or disruptions could be caused by factors beyond the control of our subcontractors, our suppliers or us, including inclement weather, natural disasters, conflicts, increased demand, problems in production or distribution, disruptions in third party logistics or transportation systems or the inability of our subcontractors or suppliers to obtain credit. These factors could be exacerbated by the impact of COVID-19 pandemic or geopolitical instability. This may reduce the profit we realize or result in a loss on a project for which the services or materials were needed or, if the product is unavailable, prevent us from accepting orders.
We may lose money on fixed-price contracts, and we are exposed to liquidated damages charges and warranty claims in many of our customer contracts.
We often agree to provide products and services under fixed-price contracts, including our turnkey solutions. Under these contracts, we are typically responsible for all cost overruns, other than the amount of any cost overruns resulting from requested changes in order specifications. Our actual costs and any gross profit realized on these fixed-price contracts could vary from the estimated costs on which these contracts were originally based. This may occur for various reasons, including errors in estimates or bidding, changes in availability and cost of labor and raw materials and unforeseen technical and logistical challenges, including with managing our geographically widespread operations and use of third party subcontractors, suppliers and manufacturers in many countries. These variations and the risks inherent in our projects may result in reduced profitability or losses on projects. Depending on the size of a project, variations from estimated contract performance could have a material adverse impact on our project revenue and operating results. In addition, many of our customer contracts, including fixed-price contracts, contain liquidated damages and warranty provisions for which we are responsible in the event that we fail to perform our obligations thereunder in a timely manner or our products or services fail to perform, in accordance with the agreed terms, conditions and standards.
We extend credit to customers in conjunction with our performance under fixed-price contracts which subjects us to potential credit risks.
We typically agree to allow our customers to defer payment on projects until certain milestones have been met or until the projects are substantially completed, and customers typically withhold some portion of amounts due to us as retainage. Our payment arrangements subject us to potential credit risk related to changes in business and economic factors affecting our customers, including material changes in our customers' revenues or cash flows. These credit risks may be exacerbated by the effects of the global pandemic. If we are unable to collect amounts owed to us, or retain amounts paid to us, our cash flows would be reduced, and we could experience losses if those amounts exceed current allowances. Any of these factors could adversely impact our business and results of operations.
We may not achieve some or all of the expected benefits of our operational initiatives.
In order to align our operational resources with our business strategies, operate more efficiently and control costs, we may periodically announce plans to restructure certain of our operations, such as consolidation of manufacturing facilities, transitions to cost-competitive regions and product line rationalizations. We may also undertake restructuring actions and workforce reductions. For example, during fiscal 2021, we enacted certain restructuring initiatives to align our current cost structure with the decline in demand for our products and services primarily due to COVID-19 and supply/demand fluctuations in commodity prices. Refer to Item 8, Financial Statements and Supplementary Data for more discussion. Risks associated with these actions include delays in execution, additional unexpected costs, realization of fewer than estimated productivity improvements and adverse effects on employee morale. If these risks materialize, we may not realize all or any of the anticipated benefits of such restructuring plans, which could have a material adverse effect on our business, financial condition, results of operations and cash flows.
Unforeseen difficulties with expansions, relocations or consolidations of existing facilities could adversely affect our operations.
From time to time we may decide to enter new markets, build or lease additional facilities, expand our existing facilities, relocate or consolidate one or more of our operations or exit a facility we may own or lease. Increased costs and production delays arising from the staffing, relocation, sublease, expansion or consolidation of our facilities could adversely affect our business and results of operations.
Legal and Regulatory Risks
Due to the nature of our business, we may be liable for damages based on product liability claims. We are also exposed to potential indemnity claims from customers for losses due to our work or if our employees are injured performing services.
We face a risk of exposure to legal claims and costs of litigation in the event that the failure, use or misuse of our products results in, or is alleged to result in, death, bodily injury, property damage or economic loss. Although we maintain quality controls and procedures, we cannot be sure that our products will be free from defects. If any of our products prove to be defective, we may be required to replace the product. In addition, we may be required to recall or redesign such products, which could result in significant unexpected costs. Some of our products contain components manufactured by third parties, which may also have defects. In addition, if we are installing our products, we may be subject to claims that our installation has caused damage or loss. Our products are often installed in our customers' or end-users' complex and capital intensive facilities involved in inherently hazardous or dangerous industries, including energy, chemical processing and power generation, where the potential liability from risk of loss could be substantial. Although we currently maintain product liability coverage, which we believe is adequate for the continued operation of our business, we cannot be certain that this insurance coverage will continue to be available to us at a reasonable cost or, if available, will be adequate to cover any potential liabilities. With respect to components manufactured by third-party suppliers, the contractual indemnification that we seek from our third-party suppliers may be insufficient to cover claims made against us. In the event that we do not have adequate insurance or contractual indemnification, product liabilities and other claims could have a material adverse effect on our business, financial condition or results of operations.
Under our customer contracts, we often indemnify our customers from damages and losses they incur due to our work or services performed by us, as well as for losses our customers incur due to any injury or loss of life suffered by any of our employees or our subcontractors' personnel occurring on our customer's property. Substantial indemnity claims may exceed the amount of insurance we maintain and could have a material adverse effect on our reputation, business, financial condition or results of operations.
We operate in many different jurisdictions and we could be adversely affected by violations of the U.S. Foreign Corrupt Practices Act and similar foreign anti-corruption laws.
The U.S. Foreign Corrupt Practices Act (the “FCPA”) and similar foreign anti-corruption laws generally prohibit companies and their intermediaries from making improper payments or providing anything of value to influence foreign government officials for the purpose of obtaining or retaining business or obtaining an unfair advantage. Recent years have seen a substantial increase in the global enforcement of anti-corruption laws, with more frequent voluntary self-disclosures by companies, aggressive investigations and enforcement proceedings by both the DOJ and the SEC resulting in record fines and
penalties, increased enforcement activity by non-U.S. regulators, and increases in criminal and civil proceedings brought against companies and individuals. Because many of our customers, sales channels and end-users are involved in infrastructure construction and energy production, they are often subject to increased scrutiny by regulators. Our internal policies mandate compliance with these anti-corruption laws. However, we operate in many parts of the world that are recognized as having governmental corruption problems to some degree and where strict compliance with anti-corruption laws may conflict with local customs and practices. Our continued operation and expansion outside the U.S., including in developing countries, could increase the risk of such violations in the future. Despite our training and compliance programs, we cannot assure you that our internal control policies and procedures always will protect us from unauthorized reckless or criminal acts committed by our employees or agents. In the event that we believe or have reason to believe that our employees or agents have or may have violated applicable anti-corruption laws, including the FCPA, we may be required to investigate or have outside counsel investigate the relevant facts and circumstances, which can be expensive and require significant time and attention from senior management. Violations of these laws may result in severe criminal or civil sanctions, which could disrupt our business and result in adverse effects on our reputation, business, results of operations or financial condition.
Our international operations and non-U.S. subsidiaries are subject to a variety of complex and continually changing laws and regulations and, in particular, export control regulations or sanctions.
Due to the international scope of our operations, we are subject to a complex system of laws and regulations, including regulations issued by the U.S. Department of Justice (the “DOJ”), the SEC, the IRS, the U.S. Department of Treasury, the U.S. Department of State, Customs and Border Protection, Bureau of Industry and Security (“BIS”), Office of Anti-Boycott Compliance (“OAC”) and Office of Foreign Asset Control (“OFAC”), as well as the counterparts of these agencies in foreign countries. Since the commencement of the Russo-Ukranian war in 2022, many of these regulations have expanded significantly and become increasingly complex. While we believe we are in material compliance with these regulations and maintain programs intended to achieve compliance, we may currently or may in the future be in violation of these regulations. For example, in 2009, we entered into settlement agreements with BIS and OFAC, and in 2010, we entered into a settlement agreement with OAC, in each case with respect to matters we voluntarily disclosed to such agencies. Any alleged or actual violations of these regulations may subject us to government scrutiny, investigation and civil and criminal penalties and may limit our ability to export our products or provide services outside the U.S. Additionally, we cannot predict the nature, scope or effect of future regulatory requirements to which our international operations might be subject or the manner in which existing laws might be administered or interpreted.
In addition, our geographically widespread operations, coupled with our relatively smaller offices in many countries and our reliance on third party subcontractors, suppliers and manufacturers in the completion of our projects, make it more difficult to oversee and ensure that all our offices and employees comply with our internal policies and control procedures. We have experienced immaterial employee theft in the past, and we cannot assure you that we can ensure our employees compliance with our internal control policies and procedures.
Changes in government administrative policy, including changes to existing trade agreements and government sanctions, could have a material adverse effect on us.
As a result of changes to government administrative policy, there may be changes to existing trade agreements, greater restrictions on free trade generally, significant increases in tariffs on goods imported into the U.S., Canada or the European Union, particularly tariffs on products manufactured in China and Mexico, among other possible changes. Changes in social, political, regulatory and economic conditions or in laws and policies governing foreign trade, manufacturing, development and investment in the territories and countries where we currently manufacture and sell products, and any resulting negative sentiments towards U.S. companies as a result of such changes, could have an adverse effect on our business, financial condition, results of operations and cash flows.
The current geopolitical instability in Russia and Ukraine and related sanctions by the U.S. and Canadian governments and European Union against certain companies and individuals may hinder our ability to conduct business with potential or existing customers and vendors in these countries and may otherwise adversely affect our global business and results of operations.
We derived approximately 2%, 5%, and 8% of our revenue from our subsidiary incorporated in Russia in the fiscal years ended March 31, 2023, 2022 and 2021, respectively. The Russo-Ukrainian war has negatively impacted our operations, sales, and future growth prospects in that region. The U.S., Canada, and European Union and other governments have imposed sanctions restricting companies from conducting business with specified Russian, Belarusian and Ukrainian individuals and companies. As a result of the continued impact of the Russo-Ukrainian war, including the sanctions related thereto, the Company commenced a strategic assessment of its operations in Russia, and, on January 31, 2023, the board of directors authorized the Company to withdraw from its operations in the Russian Federation, through a planned disposition of its Russian subsidiary.
Further escalation of geopolitical tensions related to the war, including increased trade barriers or restrictions on global trade, could result in, among other things, cyberattacks, supply disruptions, lower customer demand, and changes to foreign exchange rates and financial markets, any of which may adversely affect our business and supply chain. We cannot provide assurance that current sanctions or potential future changes in sanctions will not have a material impact on our operations in the region or on our financial results. At March 31, 2023, backlog associated with our Russian affiliate was $12.1 million. The Russo-Ukrainian war could also have the effect of heightening other risks described elsewhere in these Risk Factors.
We are subject to numerous environmental and health and safety laws and regulations, as well as potential environmental liabilities, which may require us to make substantial expenditures.
Our operations and properties are subject to a variety of federal, state, local and foreign environmental laws and regulations, including those governing the discharge of pollutants into the air or water, the management and disposal of hazardous substances or wastes, the cleanup of contaminated sites and workplace health and safety. As an owner or operator of real property, or generator of waste, we could become subject to liability for environmental contamination, regardless of whether we caused such contamination. Certain environmental laws, including the Comprehensive Environmental Response, Compensation, and Liability Act, impose joint and several liability for cleanup costs, without regard to fault, on persons who have disposed of or released hazardous substances into the environment. In addition, we could become liable to third parties for damages resulting from the disposal or release of hazardous substances into the environment. Some of our operations require environmental permits and controls to prevent and reduce air and water pollution, and these permits are subject to modification, renewal and revocation by issuing authorities. From time to time, we could be subject to requests for information, notices of violation, and/or investigations initiated by environmental regulatory agencies relating to our operations and properties. Violations of environmental and health and safety laws can result in substantial penalties, civil and criminal sanctions, permit revocations, and facility shutdowns. Environmental and health and safety laws may change rapidly and have tended to become more stringent over time. As a result, we could incur costs for past, present, or future failure to comply with all environmental and health and safety laws and regulations. In addition, we could become subject to potential regulations concerning the emission of greenhouse gases or disclosure regarding such emissions, and while the effect of such future regulations cannot be determined at this time, they could require us to incur substantial costs in order to achieve and maintain compliance. In the ordinary course of business, we may be held responsible for any environmental damages we may cause to our customers' premises.
The effects of climate change and any related regulation of greenhouse gases could have a negative impact on our business.
Governments around the world are increasingly focused on enacting laws and regulations regarding climate change and regulation of greenhouse gases. Lawmakers and regulators in the jurisdictions where we operate have proposed or enacted regulations requiring reporting of greenhouse gas emissions and the restriction thereof, including the SEC’s recent rule proposal for climate change disclosure, increased fuel efficiency standards, carbon taxes or cap and trade systems, restrictive permitting, and incentives for renewable energy. In addition, efforts have been made and continue to be made in the international community toward the adoption of international treaties or protocols that would address global climate change issues and impose reductions of hydrocarbon-based fuels, including plans developed in connection with the Paris climate conference in December 2015 and the Katowice climate conference in December 2018. Laws or regulations incentivizing or mandating the use of alternative energy sources such as wind power and solar energy have also been enacted in certain jurisdictions. Additionally, numerous large cities globally and several countries have adopted programs to mandate or incentivize the conversion from internal combustion engine powered vehicles to electric-powered vehicles and placed restrictions on non-public transportation. Such policies or other laws, regulations, treaties and international agreements related to greenhouse gases and climate change may negatively impact the price of oil relative to other energy sources, reduce demand for hydrocarbons, or otherwise unfavorably impact our customers in the oil, gas, power generation and petrochemical industries. To the extent our customers, particularly our energy and industrial customers, are subject to any of these or other similar proposed or newly enacted laws and regulations or impacted by the change in energy prices due to such laws and regulations, we are exposed to risks that the additional costs incurred by customers to comply with such laws and regulations or that the deterioration of customers’ financial results as a result of changing energy prices could impact our customers’ ability or desire to continue to operate at similar levels in certain jurisdictions as historically seen or as currently anticipated, which could negatively impact their demand for our products and services. These laws and regulations could also increase costs associated with our operations, including costs for raw materials and transportation and compliance with enhanced climate change-related disclosure requirements. The ultimate impact of greenhouse gas emissions-related agreements, legislation, disclosure requirements and related measures on our financial performance is highly uncertain because we are unable to predict with certainty, for a multitude of individual jurisdictions, the outcome of political decision-making processes and the variables and trade-offs that inevitably occur in connection with such processes.
In addition to potential impacts on our business resulting from climate-change legislation or regulations, our business also could be negatively affected by climate-change related physical changes or changes in weather patterns. An increase in severe weather patterns could result in damages to or loss of our manufacturing facilities, impact our ability to conduct our
operations and/or result in a disruption of our customers’ operations. In addition, volatility in weather patterns could exacerbate the cyclicality of demand for our heating products.
Risks Related to Ownership of Our Common Stock
Our quarterly operating results may vary significantly, which could negatively impact the price of our common stock.
Our quarterly results of operations have fluctuated in the past and will continue to fluctuate in the future. You should not rely on the results of any past quarter or quarters as an indication of future performance in our business operations or the price of our common stock. Factors that might cause our operating results to vary from quarter to quarter include, but are not limited to:
•general economic conditions and cyclicality in the end markets we serve;
•the effects of the ongoing COVID-19 pandemic or other global pandemics, conflicts, or catastrophes;
•future growth of energy and chemical processing capital investments;
•a material disruption at any of our manufacturing facilities;
•delays in our customers' projects for which our products are a component;
•the timing of completion of large projects;
•costs associated with regulatory compliance;
•competition from various other sources providing similar heat tracing products and services, or other alternative technologies, to customers; and
•the seasonality of demand for maintenance orders, which is typically highest during our second and third fiscal quarters.
If our results of operations from quarter to quarter fail to meet the expectations of securities analysts and investors, the price of our common stock could be negatively impacted.
The market price of our common stock may fluctuate significantly, and this may make it difficult for holders to resell our common stock when they want or at prices that they find attractive.
The price of our common stock on the NYSE constantly changes. We expect that the market price of our common stock will continue to fluctuate. The market price of our common stock may fluctuate as a result of a variety of factors, many of which are beyond our control. These factors include, but are not limited to:
•quarterly fluctuations in our operating results;
•changes in investors' and analysts' perception of the business risks and conditions of our business or our competitors;
•our ability to meet the earnings estimates and other performance expectations of financial analysts or investors;
•unfavorable commentary or downgrades of our stock by equity research analysts;
•the emergence of new sales channels in which we are unable to compete effectively;
•disruption to our operations;
•fluctuations in the stock prices of our peer companies or in stock markets in general; and
•general economic or political conditions, including the effects of the COVID-19 pandemic.
In addition, in recent years, global equity markets have experienced extreme price and volume fluctuations. This volatility has had a significant effect on the market price of securities issued by many companies for reasons often unrelated to their operating performance. These broad market fluctuations may adversely affect the market price of our common stock, regardless of our operating results and cash flows.
Anti-takeover provisions contained in our charter and bylaws could impair a takeover attempt that our stockholders may find beneficial.
Our second amended and restated certificate of incorporation, amended and restated bylaws and Delaware law contain provisions that could have the effect of rendering more difficult, or discouraging, an acquisition deemed undesirable by our board of directors. Our corporate governance documents include provisions:
•authorizing our board of directors, without further action by the stockholders, to issue blank check preferred stock;
•limiting the ability of our stockholders to call and bring business before special meetings and to take action by written consent in lieu of a meeting;
•requiring advance notice of stockholder proposals for business to be conducted at meetings of our stockholders and for nominations of candidates for election to our board of directors;
•authorizing our board of directors, without stockholder approval, to amend our amended and restated bylaws;
•limiting the determination of the number of directors on our board of directors and the filling of vacancies or newly created seats on our board of directors to our board of directors then in office; and
•subject to certain exceptions, limiting our ability to engage in certain business combinations with an "interested stockholder" for a three-year period following the time that the stockholder became an interested stockholder.
These provisions, alone or together, could delay hostile takeovers and changes in control of the Company or changes in our management.
Though we have opted out of the Delaware anti-takeover statute, our second amended and restated certificate of incorporation contains provisions that are similar to the Delaware anti-takeover statute, which may impair a takeover attempt that our stockholders may find beneficial. Any provision of our second amended and restated certificate of incorporation or amended and restated bylaws that has the effect of delaying or deterring a change in control could limit the opportunity for our stockholders to receive a premium for their shares of our common stock, and could also affect the price that some investors are willing to pay for our common stock.
We do not currently intend to pay dividends on our common stock and, consequently, your ability to achieve a return on your investment will depend on appreciation in the price of our common stock.
We do not expect to pay dividends on our common stock. Any future dividend payments are within the discretion of our board of directors or a duly authorized committee of the board of directors and will depend on, among other things, our results of operations, working capital requirements, capital expenditure requirements, financial condition, level of indebtedness, contractual restrictions with respect to payment of dividends, business opportunities, anticipated cash needs, provisions of applicable law and other factors that our board of directors may deem relevant. In particular, our credit facility limits our ability to pay dividends from cash generated from operations. We may not generate sufficient cash from operations in the future to pay dividends on our common stock. See Item 5, "Market for Registrant's Common Equity, Related Stockholder Matters and Issuer Purchases of Equity Securities-Dividend Policy."
ITEM 1B. UNRESOLVED STAFF COMMENTS
None.
ITEM 2. PROPERTIES
Our headquarters and principal executive offices are located at 7171 Southwest Parkway, Building 300, Austin, Texas.
Our principal manufacturing and warehousing operations are located at our facilities in San Marcos, Texas. We own our principal manufacturing and warehousing facilities, and lease one ancillary manufacturing facility in San Marcos, Texas. All our reportable segments utilize our San Marcos, Texas facilities. In addition, we have offices and/or manufacturing and assembly locations in Houston, Texas, Denver, Colorado, Canada, Salt Lake City, Utah, the Netherlands, France, United Kingdom, Germany, Russia, Mexico, China, Korea, Japan, India, Australia, and Bahrain. All our manufacturing facilities are registered to International Organization for Standardization (ISO) 9001 quality standards. We believe that our production facilities are suitable for their purpose and are adequate to support our businesses.
ITEM 3. LEGAL PROCEEDINGS
For information on legal proceedings, see Note 15, "Commitments and Contingencies" to our consolidated financial statements contained elsewhere in this annual report, which is hereby incorporated by reference into this Item 3.
ITEM 4. MINE SAFETY DISCLOSURES
Not applicable.
PART II
ITEM 5. MARKET FOR REGISTRANT'S COMMON EQUITY, RELATED STOCKHOLDER MATTERS AND ISSUER PURCHASES OF EQUITY SECURITIES
The common stock of the Company trades on the NYSE under the symbol "THR." On May 24, 2023, the closing sale price of our common stock, as reported by the NYSE, was $22.94. As of May 24, 2023, there were approximately 15 holders of our common stock of record.
Stock Performance
The following line graph and table present a comparison of cumulative total returns for our common stock on an annual basis over the last five fiscal years as compared to (i) the Russell 2000 Index, and (ii) the S&P SmallCap 600 - Capped Energy Index, in each case over the same period. The plotted points in the line graph are based on the closing price on the last trading date of the period. The values assume an initial investment of $100 was made in our common stock and the respective indexes on March 31, 2018 (the last day of our fiscal 2018), and assumes the reinvestment of dividends, as applicable. The stock price performance shown below is not necessarily indicative of future price performance.
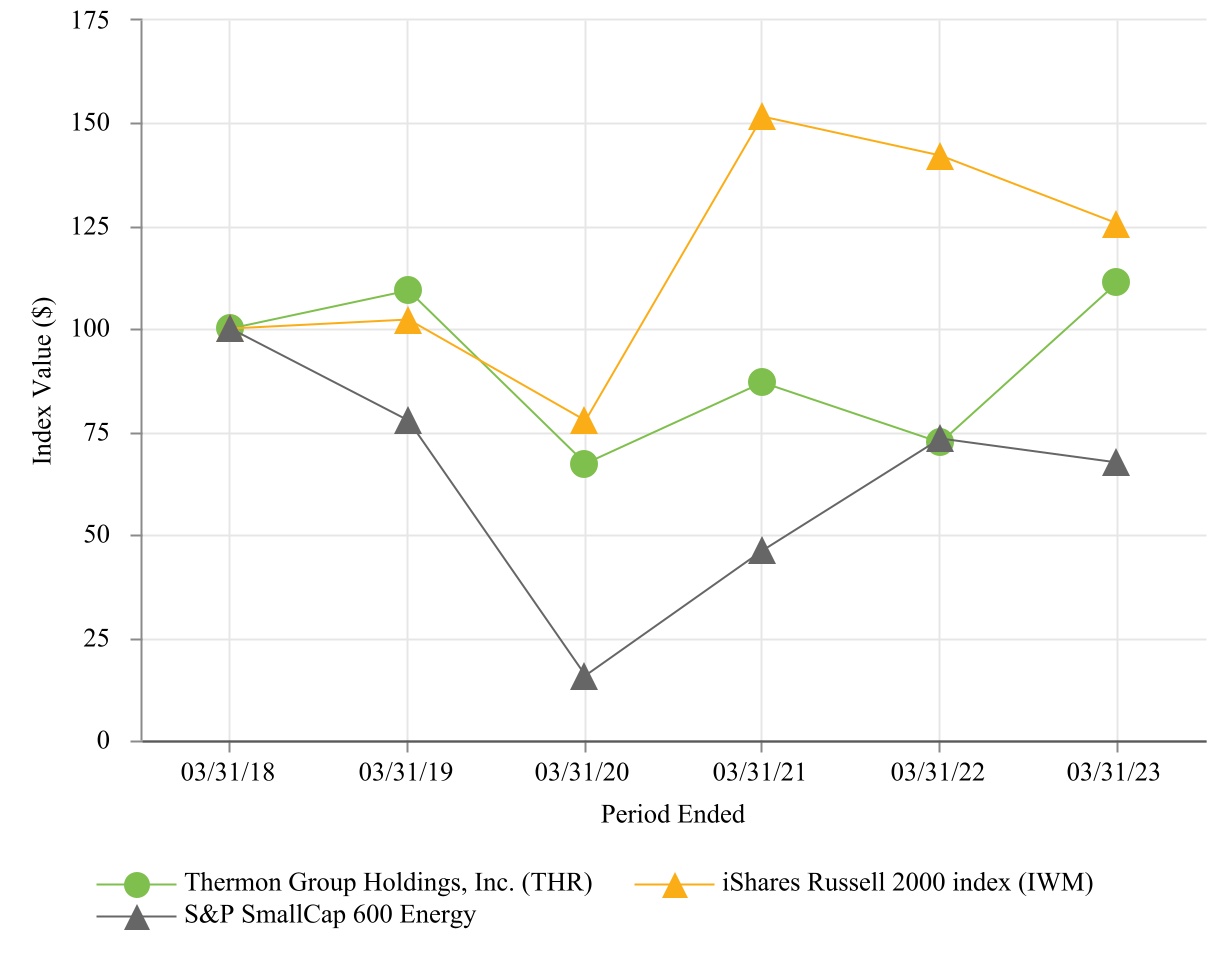
| | | | | | | | | | | | | | | | | | | | |
| March 31, 2018 | March 31, 2019 | March 31, 2020 | March 31, 2021 | March 31, 2022 | March 31, 2023 |
| Thermon Group Holdings, Inc. | $ | 100.00 | | $ | 109.37 | | $ | 67.25 | | $ | 86.97 | | $ | 72.29 | | $ | 111.20 | |
| iShares Russell 2000 Index | $ | 100.00 | | $ | 102.11 | | $ | 77.74 | | $ | 151.44 | | $ | 142.13 | | $ | 125.48 | |
| S&P 600 SmallCap 600 Energy | $ | 100.00 | | $ | 77.72 | | $ | 15.75 | | $ | 45.94 | | $ | 73.19 | | $ | 67.48 | |
The information in this "Stock Performance" section shall not be deemed to be "soliciting material" or to be "filed" with the SEC or subject to Regulation 14A or 14C, or to the liabilities of Section 18 of the Exchange Act.
Dividend Policy
Since our initial public offering in May 2011, we have not declared or paid any cash dividends on our capital stock, and we do not currently intend to pay any cash dividends on our common stock. We intend to retain earnings to finance the growth and development of our business and for working capital and general corporate purposes. We also use our cash to make unscheduled principal repayments on our debt over and above the required amounts.
Any payment of dividends will be at the discretion of our board of directors and will depend upon our earnings, financial condition, capital requirements, level of indebtedness, contractual restrictions with respect to payment of dividends, restrictions imposed by applicable law and other factors. In particular, our credit facility limits our ability to pay dividends from cash generated from operations. See Item 7, "Management's Discussion and Analysis of Financial Condition and Results of Operations-Liquidity and Capital Resources."
Equity Compensation Plan Information
For information on our equity compensation plans, see Item 12, "Security Ownership of Certain Beneficial Owners and Management and Related Stockholder Matters-Equity Compensation Plan Information." See also Note 16, "Stock-Based Compensation Expense" to our consolidated financial statements included elsewhere in this annual report.
Issuer Purchases of Equity Securities
None.
Recent Sales of Unregistered Securities
None.
ITEM 6. SELECTED FINANCIAL DATA
Discussion was omitted pursuant to SEC Release 33-10890. Please refer to past filings on our website or sec.gov for relevant historical financial information.
ITEM 7. MANAGEMENT'S DISCUSSION AND ANALYSIS OF FINANCIAL CONDITION AND RESULTS OF OPERATIONS
The following discussion should be read in conjunction with, and is qualified in its entirety by reference to, Item 6, "Selected Financial Data" and our consolidated financial statements and related notes included elsewhere in this annual report. The discussions in this section contain forward-looking statements that involve risks and uncertainties, including, but not limited to, those described in Item 1A, "Risk Factors." Actual results could differ materially from those discussed below. Please refer to the section entitled "Forward-Looking Statements."
Overview
For a complete overview of our business, please refer to Item 1. "Business" disclosed within this document.
Recent Developments. The global economy has been negatively impacted by the war between Russia and Ukraine. Furthermore, governments in the United States, Canada, and European Union, among others, have imposed trade controls on certain products and economic sanctions on certain industry sectors and parties in Russia. Further escalation of geopolitical tensions related to the war, including increased trade barriers or restrictions on global trade, could result in, among other things, cyberattacks, supply disruptions, lower customer demand, and changes to foreign exchange rates and financial markets, any of which may adversely affect our business and supply chain. Refer to Item 1A, "Risk Factors" in this annual report on Form 10-K for further discussion regarding our risks.
As a result of the continued impact of the Russo-Ukrainian war, including the sanctions related thereto, the Company commenced a strategic assessment of its operations in the Russian Federation, and, on January 31, 2023, our board of directors authorized the Company to withdraw from its operations in the Russian Federation (the “Russia Exit”), through a planned disposition of its Russian subsidiary. We announced this decision in a current report on Form 8-K dated February 2, 2023. In fiscal 2023, we recorded total charges of $12.6 million related to the Russia Exit as well as $0.2 million in transaction costs to prepare for the disposal of the subsidiary. We expect to complete the Russia Exit by the end of the second fiscal quarter of fiscal 2024, subject to the receipt of the requisite regulatory approvals.
Our Russian affiliate represented approximately 2% of Thermon’s worldwide revenue during fiscal 2023.
The Company continues to invest in our three long-term strategic initiatives. First, we expect to diversify our revenues into adjacent markets like commercial, food & beverage, transportation and other non-oil and gas industries where we can continue to differentiate our offerings through quality, safety and customer service, while also aligning Thermon’s strategy around the energy transition toward a more sustainable global economy. Second, we anticipate a multi-decades investment trend to emerge based on the rapidly increasing desire for industrial customers to electrify equipment to reduce their carbon footprint, which represents an opportunity for the Company. Thermon's process heating expertise will be a key factor in a successful, sustainable transition, and we expect to invest in additional resources to quickly respond to changing customer demand. Finally, we will continue expanding our technology-enabled maintenance solutions, like our recently launched Genesis Network, which helps our customers more efficiently and safely monitor and maintain their heating systems by utilizing our software, analytics, hardware and process heating maintenance expert services. Our efforts to diversify the business's end markets is starting to show early signs of success through increased customer engagement in diversified end markets such as rail and transit, food and beverage, commercial and power. Additionally, we are continuing to receive orders from key customers related to our recently launched Genesis Network technology, which helps our customers more efficiently and safely monitor and maintain their heating systems by utilizing our software, analytics, hardware and process heating maintenance expert services. We are benefiting from the increasing global demand for our solutions, particularly in North America.
Revenue. Our revenues are derived from providing customers with a full suite of innovative and reliable process heating solutions, including advanced heating and filtration solutions for industrial and hazardous area applications. Revenue recognized at a point in time based on when control transitions to the customer is generally related to our product sales. Point in time revenue does not typically require engineering or installation services. Revenue recognized over time occurs on our projects where engineering or installation services, or a combination of the two, are required. We recognize revenue related to such projects in a systematic way that reflects the transfer of goods or services, or a combination of goods and services, to the customer.
We believe that our pipeline of planned projects, in addition to our backlog of signed purchase orders, provides us with visibility into our future revenue. Historically we have experienced few order cancellations, and the cancellations that have occurred in the past have not been material compared to our total contract volume or total backlog. The small number of order cancellations is attributable in part to the fact that a large portion of our solutions are ordered and installed toward the end of
large project construction. Our backlog at March 31, 2023 was $163.3 million as compared to $156.2 million at March 31, 2022. The timing of recognition of revenue out of backlog is not always certain, as it is subject to a variety of factors that may cause delays, many of which are beyond our control (such as, customers' delivery schedules and levels of capital and maintenance expenditures). When delays occur, the recognition of revenue associated with the delayed project is likewise deferred.
Cost of sales. Our cost of sales includes primarily the cost of raw material items used in the manufacture of our products, cost of ancillary products that are sourced from external suppliers and construction labor costs. Additional costs of sales include contract engineering costs directly associated to projects, direct labor costs, shipping and handling costs, and other costs associated with our manufacturing/fabrication operations. The other costs associated with our manufacturing/fabrication operations are primarily indirect production costs, including depreciation, indirect labor costs, warranty-related costs and the costs of manufacturing support functions such as logistics and quality assurance. Key raw material costs include polymers, copper, stainless steel, insulating material, electronic components and other miscellaneous parts related to products manufactured or assembled. Raw material costs have been stable in the past; however, we are experiencing an increase in costs of these materials due to: use of alternate suppliers, higher freight costs, increased lead times, expedited shipping and other inflationary factors. Also, we have seen labor inefficiencies and increased overtime in certain of our facilities due to temporary shortages in raw materials required for production, as well as time and attendance issues and labor shortages in certain of our facilities. We cannot provide any assurance that we will continue to be able to mitigate temporary raw material shortages or be able to pass along such cost increases, including the potential impacts of tariffs, to our customers in the future, and if we are unable to do so, our results of operations may be adversely affected.
Operating expenses. Our selling, general, and administrative expenses ("SG&A") are primarily comprised of compensation and related expenses for sales, marketing, pre-sales engineering and administrative personnel, as well as other sales related expenses and other expenses related to research and development, insurance, professional fees, the global integrated business information system, and provisions for bad debts.
Key drivers affecting our results of operations. Our results of operations and financial condition are affected by numerous factors, including those described under the caption “Risk Factors” in our Annual Report on Form 10-K for the fiscal year ended March 31, 2022, filed with the SEC on May 26, 2022, and in any subsequent Quarterly Reports on Form 10-Q that we have filed or may file with the SEC, including those described below. These factors include the following:
•Impact of product mix. Typically, our customers require our products as well as our engineering and construction services. The level of service and construction needs affect the profit margin for each type of revenue.
We tend to experience lower margins from our design optimization, engineering, installation and maintenance services, which are typically large projects tied to our customers' capital expenditure budgets and are comprised of more than $0.5 million in total revenue. For clarity, we will refer to these as "Over time large projects." Our results of operations in recent years have been impacted by the various construction phases of Over time large projects. We are typically designated as the heat tracing or heating system engineering provider of choice by the project owner. We then engage with multiple contractors to address incorporating various heat tracing solutions throughout the overall project. Our largest projects may generate revenue for several quarters. In the early stages of an Over time large project, our revenues are typically realized from the provision of engineering services. In the middle stages, or the material requirements phase, we typically experience the greatest demand for our heat tracing cable, at which point our revenues tend to accelerate. Revenues tend to decrease gradually in the final stages of a project and are generally derived from installation services and demand for electrical panels and other miscellaneous electronic components used in the final installation of heat tracing cable, which we frequently outsource from third-party manufacturers.
Projects which do not require installation and maintenance services are smaller in size and representative of maintenance, repairs and small upgrades necessary to improve efficiency and uptime. These small projects are typically tied to our customers operating expense budgets, are generally less than $0.5 million in total revenue, and have relatively higher profit margins. We will refer to such projects as "Over time small projects."
The most profitable of our sales are derived from selling our heating products, for which we recognize revenue at a point in time. We also tend to experience lower margins from our outsourced products, such as electrical switch gears and transformers, than we do from our manufactured products. Accordingly, our results of operations are impacted by our mix of products and services.
We estimate that Point in time and Over time revenues have each made the following contribution as a percentage of total revenue in the periods listed:
| | | | | | | | | | | | | | | | | | | | | |
| Year-Ended March 31, 2023 | | Year-Ended March 31, 2022 | | Year-Ended March 31, 2021 | | |
| Point in time | 63 | % | | 60 | % | | 59 | % | | | | |
| Over time: | 37 | % | | 40 | % | | 41 | % | | | | |
| Small projects | 15 | % | | 16 | % | | 16 | % | | | | |
| Large projects | 22 | % | | 24 | % | | 25 | % | | | | |
Our Over time revenue includes (i) products and services which are billed on a time and materials basis, and (ii) fixed fee contracts for complex turnkey solutions. For our time and materials service contracts, we recognize revenues as the products and services are provided over the term of the contract and have determined that the stated rate for installation services and products is representative of the stand-alone selling price for those services and products.
Our turnkey projects, or fixed fee projects, offer our customers a comprehensive solution for heat tracing from the initial planning stage through engineering/design, manufacture, installation and final proof-of-performance and acceptance testing. Turnkey services also include project planning, product supply, system integration, commissioning and ongoing maintenance. Turnkey solutions, containing multiple deliverables, are customer specific and do not have an alternative use and present an unconditional right to payment, and thus are treated as a single performance obligation with revenues recognized over time as work progresses.
For revenue recognized under fixed fee turnkey contracts, we measure the costs incurred that contribute towards the satisfaction of our performance obligation as a percentage of the total cost of production (the “cost-to-cost method”), and we recognize a proportionate amount of contract revenue, as the cost-to-cost method appropriately depicts performance towards satisfaction of the performance obligation. Changes to the original cost amount may be required during the life of the contract and such estimates are reviewed on a regular basis. Sales and gross profits are adjusted using the cumulative catch-up method for revisions in estimated contract costs. Reviews of estimates have not generally resulted in significant adjustments to our results of operations.
Point in time revenue represents goods transferred to customers at a point in time and is recognized when obligations under the terms of the contract with the customer are satisfied; generally this occurs with the transfer of control upon shipment.
•Cyclicality of end users' markets. Demand for our products and services depends in large part upon the level of capital and maintenance expenditures of our customers and end users, in particular those in the energy, oil, gas, chemical processing and power generation industries, and firms that design and construct facilities for these industries. These customers' expenditures historically have been cyclical in nature and vulnerable to economic downturns. Large projects historically have been a substantial source of revenue growth, and large project revenues tend to be more cyclical than maintenance and repair revenues. A sustained decrease in capital and maintenance spending or in new facility construction by our customers could have a material adverse effect on the demand for our products and services and our business, financial condition and results of operations.
•Acquisition strategy. In recent years, we have been executing on a strategy to grow the Company through the acquisition of businesses that are either in the process heating solutions industry or provide complementary products and solutions for the markets and customers we serve. Refer to Note 2, "Acquisition," for more discussion of our recent acquisition.
Results of Operations
The following table sets forth data from our statements of operations for the periods indicated.
| | | | | | | | | | | | | | | | | | | | | | | |
| | Fiscal Year Ended March 31, | | Increase/(Decrease) |
| (Dollars in thousands) | 2023 | | 2022 | | $ | | % |
| Consolidated Statements of Operations Data: | | | | | | | |
| Sales | $ | 440,590 | | | $ | 355,674 | | | $ | 84,916 | | | 24 | % |
| Cost of sales | 255,465 | | | 215,556 | | | 39,909 | | | 19 | % |
| Gross profit | 185,125 | | | 140,118 | | | 45,007 | | | 32 | % |
| Operating expenses: | | | | | | | |
| Selling, general and administrative expenses | 117,003 | | | 93,054 | | | 23,949 | | | 26 | % |
| Deferred compensation plan expense/(income) | (208) | | | 283 | | | (491) | | | (173) | % |
| Amortization of intangible assets | 9,447 | | | 8,790 | | | 657 | | | 7 | % |
| Restructuring and other charges/(income) | 3,693 | | | (414) | | | 4,107 | | | (992) | % |
| Income/(loss) from operations | 55,190 | | | 38,405 | | | 16,785 | | | 44 | % |
| Other income/(expenses): | | | | | | | |
| Interest expense, net | (5,871) | | | (5,815) | | | (56) | | | 1 | % |
| Other income/(expense) | (86) | | | (4,165) | | | 4,079 | | | (98) | % |
| Income/(loss) before provision for income taxes | 49,233 | | | 28,425 | | | 20,808 | | | 73 | % |
| Income tax expense/(benefit) | 15,567 | | | 8,333 | | | 7,234 | | | 87 | % |
| Net income/(loss) | $ | 33,666 | | | $ | 20,092 | | | $ | 13,574 | | | 68 | % |
| | | | | | | |
| As a percent of sales: | | | | | | | |
| Gross profit | 42.0 | % | | 39.4 | % | | 260 bps | | |
| Selling, general and administrative expenses | 26.6 | % | | 26.2 | % | | 40 bps | | |
| Income/(loss) from operations | 12.5 | % | | 10.8 | % | | 170 bps | | |
| Net income/(loss) | 7.6 | % | | 5.6 | % | | 200 bps | | |
| | | | | | | |
| Effective tax rate | 31.6 | % | | 29.3 | % | | | | |
Year Ended March 31, 2023 ("fiscal 2023") Compared to the Year Ended March 31, 2022 ("fiscal 2022")
Revenues. Revenue increased in fiscal 2023 compared to fiscal 2022 due to strong performance in our US-LAM and Canada segments. US-LAM revenue increased $55.0 million, or 36%, while Canada revenue increased $38.5 million, or 33%. Revenues in these segments were bolstered in part by strong demand from general industrial, upstream and downstream oil end markets, plus moderate growth in our diversified end markets such as rail and transit, renewables, and commercial. Additionally, our recent acquisition of Powerblanket in the US-LAM segment contributed $17.1 million in revenue growth in fiscal 2023. Revenue in our APAC segment increased $3.0 million, or 10% versus fiscal 2022. These increases were partly offset by contraction in our EMEA segment, with a decrease in revenue of $(11.6) million, or (21)%. The ongoing effects of the Russo-Ukrainian war as well as the overall recessionary environment impacted the results in EMEA. Separately, revenue was negatively impacted in fiscal 2023 by foreign exchange rates by approximately $15.1 million, though partially offset by the inverse effect within cost of sales.
Point-in-time sales grew $62.5 million and Over time sales grew $22.4 million compared to fiscal 2022. Our sales mix in fiscal 2023 was 63% Point in time sales and 37% Over time sales as compared to 60% Point in time sales and 40% Over time sales in fiscal 2022.
Gross profit. Gross profit increased in fiscal 2023 versus fiscal 2022 on greater sales volume and higher gross profit margin, as gross profit margin increased by 260 bps. This was primarily driven by our product mix, as we increased our Point in time sales (generally higher margin sales) at a higher rate than in fiscal 2022. Furthermore, gross margin was augmented by customer price increase realization, and improved margins on design, design and supply, and design, supply and installation projects. Although we faced elevated costs related to material sourcing and labor headwinds, increases in volume and favorable product mix more than offset these effects. Partially offsetting these positive drivers was a charge of $4.3 million associated with the Russia Exit.
Selling, general and administrative expenses. The increase in SG&A is due to costs associated with greater sales activity resulting in increased salaries and benefits, incentive pay, commissions, travel, and marketing expenses. In addition, expenses increased in fiscal 2023 due to the acquisition of Powerblanket. We also recognized a charge of $4.6 million related to the Russia Exit in SG&A. SG&A as a percent of sales increased by 40 bps based on the above reasons.
Amortization of intangible assets. The increase of amortization is due to adding certain intangible assets through our acquisition of Powerblanket. Refer to Note 2, "Acquisition."
Deferred compensation plan expense/(income). The change in deferred compensation plan activity is primarily attributable to market fluctuations in the underlying balances owed to employees. This compensation plan expense/(income) is materially offset in other income/(expense) where the Company records market gains/(losses) on related investment assets.
Restructuring and other charges/(income). Restructuring and other charges/(income) increased in fiscal 2023 due to charges associated with the Russia Exit in the amount of $3.7 million. Other portions of the total $12.6 million charge are discussed in SG&A and Gross profit above. Refer to Note 14, "Restructuring and Other Charges/(Income)" for additional details.
Interest expense, net. Interest expense, net was relatively flat as compared to fiscal 2022. Although we have paid down approximately $27 million in long-term debt, we borrowed against our revolving credit facility to acquire Powerblanket and our interest rate has increased throughout fiscal 2023. At the end of fiscal 2022, interest rates were 2.62% for the Canadian Term Loan Facility and 1.96% for the U.S. Term Loan Facility. As of March 31, 2023, interest rates were 6.27% for the Canadian Term Loan Facility, 5.59% for the U.S. Term Loan Facility, and 6.16% for the U.S. revolving credit facility. Our average outstanding principal, measured at the end of each quarter, including any applicable revolving credit facility balance outstanding, was $135.0 million in fiscal 2023 versus $137.4 million in fiscal 2022. See Note 12, "Long-Term Debt," for additional information.
Other income/(expense). The change in other income/(expense) primarily relates to our debt extinguishment charges of $2.6 million in fiscal 2022, as we refinanced our senior secured credit facility, and a decrease in foreign exchange losses of $1.8 million. We did not have corresponding charges in fiscal 2023. See Note 12, "Long-Term Debt," for additional information on our long-term debt and the refinancing of our senior secured credit facility.
Income taxes. Income tax expense was $15.6 million or 31.6% on pretax income of $49.2 million in fiscal 2023 as compared to an income tax expense of $8.3 million on a pretax income of $28.4 million in fiscal 2022. Our losses with regard to the Russia Exit, totaling $12.6 million, have no significant tax benefit. Excluding the tax effect of the Russia Exit, our effective tax rate would have been 25.1% in fiscal 2023. Our fiscal 2022 effective tax rate of 29.3% was within the upper end of the expected range of combined tax expense for the United States and foreign subsidiaries in which we operate. See Note 18, “Income Taxes,” for further information.
Net income/(loss). The change in net income/(loss) is explained by the changes noted in the sections above.
| | | | | | | | | | | | | | | | | | | | | | | |
| | Fiscal Year Ended March 31, | | Increase/(Decrease) |
| (Dollars in thousands) | 2022 | | 2021 | | $ | | % |
| Consolidated Statements of Operations Data: | | | | | | | |
| Sales | $ | 355,674 | | | $ | 276,181 | | | $ | 79,493 | | | 29 | % |
| Cost of sales | 215,556 | | | 159,309 | | | 56,247 | | | 35 | % |
| Gross profit | 140,118 | | | 116,872 | | | 23,246 | | | 20 | % |
| Operating expenses: | | | | | | | |
| Selling, general and administrative expenses | 93,054 | | | 89,834 | | | 3,220 | | | 4 | % |
| Deferred compensation plan expense/(income) | 283 | | | 1,564 | | | (1,281) | | | (82) | % |
| Amortization of intangible assets | 8,790 | | | 9,445 | | | (655) | | | (7) | % |
| Restructuring and other charges/(income) | (414) | | | 8,623 | | | (9,037) | | | (105) | % |
| Income/(loss) from operations | 38,405 | | | 7,406 | | | 30,999 | | | 419 | % |
| Other income/(expenses): | | | | | | | |
| Interest expense, net | (5,815) | | | (10,185) | | | 4,370 | | | (43) | % |
| Other income/(expense) | (4,165) | | | 2,135 | | | (6,300) | | | (295) | % |
| Income/(loss) before provision for income taxes | 28,425 | | | (644) | | | 29,069 | | | (4514) | % |
| Income tax expense/(benefit) | 8,333 | | | (1,521) | | | 9,854 | | | (648) | % |
| Net income/(loss) | $ | 20,092 | | | $ | 877 | | | $ | 19,215 | | | 2191 | % |
| | | | | | | |
| As a percent of sales: | | | | | | | |
| Gross profit | 39.4 | % | | 42.3 | % | | -290 bps | | |
| Selling, general and administrative expenses | 26.2 | % | | 32.5 | % | | -630 bps | | |
| Income/(loss) from operations | 10.8 | % | | 2.7 | % | | 810 bps | | |
| Net income/(loss) | 5.6 | % | | 0.3 | % | | 530 bps | | |
| | | | | | | |
| Effective tax rate | 29.3 | % | | (236.2) | % | | | | |
Year Ended March 31, 2022 ("fiscal 2022") Compared to the Year Ended March 31, 2021 ("fiscal 2021")
See Item 7, “Management’s Discussion and Analysis of Financial Condition and Results of Operations” in our Annual Report on Form 10-K for the fiscal year ended March 31, 2022 filed with the SEC on May 26, 2022 for a discussion of the results of operations in fiscal 2022 as compared to fiscal 2021.
Contingencies
We are involved in various legal and administrative proceedings that arise from time to time in the ordinary course of doing business. Some of these proceedings may result in fines, penalties or judgments being assessed against us, which may adversely affect our financial results. In addition, from time to time, we are involved in various disputes, which may or may not be settled prior to legal proceedings being instituted and which may result in losses in excess of accrued liabilities, if any, relating to such unresolved disputes. As of March 31, 2023, management believes that adequate reserves have been established for any probable and reasonably estimable losses. Expenses related to litigation reduce operating income. We do not believe that the outcome of any of these proceedings or disputes would have a significant adverse effect on our financial position, long-term results of operations, or cash flows. It is possible, however, that charges related to these matters could be significant to our results of operations or cash flows in any one reporting period.
For information on legal proceedings, see Note 15, "Commitments and Contingencies" to our consolidated financial statements contained elsewhere in this annual report, which is hereby incorporated by reference into this Item 7.
To bid on or secure certain contracts, we are required at times to provide a performance guaranty to our customers in the form of a surety bond, standby letter of credit or foreign bank guaranty. On March 31, 2023, we had in place standby letters of credit, bank guarantees and performance bonds totaling $30.8 million to back our various customer contracts. In addition, our Indian subsidiary also has $4.4 million in customs bonds outstanding. Refer to Note 15, "Commitments and Contingencies" for more information on our letters of credit and bank guarantees.
Liquidity and Capital Resources
Our primary sources of liquidity are cash flows from operations and funds available under our revolving credit facility. Our primary liquidity needs are to finance our working capital, capital expenditures, debt service needs and potential future acquisitions.
Cash and cash equivalents. At March 31, 2023, we had $35.6 million in cash and cash equivalents. We manage our global cash requirements by maintaining cash and cash equivalents at various financial institutions throughout the world where we operate. Approximately $5.9 million, or 16%, of these amounts were held in domestic accounts with various institutions and approximately $29.8 million, or 84%, of these amounts were held in accounts outside of the United States with various financial institutions. While we have cash needs at our various foreign operations, excess cash is available for distribution to the United States through intercompany dividends or debt reduction in Canada.
Generally, we seek to maintain a cash and cash equivalents balance between $30.0 and $40.0 million. We will encounter periods where we may be above or below this range, due to, for example, inventory buildup for anticipated seasonal demand in fall and winter months, related cash receipts from credit sales in months that follow, debt maturities, restructuring activities, larger capital investments, severe and/or protracted economic downturns, acquisitions, or some combination of the above activities. The Company continues to manage its working capital requirements effectively through optimizing inventory levels, doing business with creditworthy customers, and extending payments terms with its supplier base.
Senior secured credit facility
See Note 12, “Long-Term Debt” to our consolidated financial statements and accompanying notes thereto included in Item 8 of this annual report for additional information on our senior secured term loan and revolving credit facilities, which is hereby incorporated by reference into this Item 7. At March 31, 2023, we had $14.5 million outstanding borrowings under our revolving credit facility and $83.7 million of available capacity thereunder, after taking into account the borrowing base and letters of credit outstanding, which totaled $16.3 million. From time to time, we may choose to utilize our revolving credit facility to fund operations, acquisitions or other investments, despite having cash available within our consolidated group in light of the cost, timing and other business considerations.
As of March 31, 2023, we had $97.9 million of outstanding principal on our term loan A facility, net of deferred debt issuance costs. Commencing January 1, 2022, each of the Term Loans will amortize as set forth in the table below, with payments due on the first day of each January, April, July and October, with the balance of each Term Loan Facility due at maturity.
| | | | | | | | |
| Installment Dates | | % of Original Principal Amount |
| January 1, 2022 through October 1, 2022 | | 1.25 | % |
| January 1, 2023 through October 1, 2024 | | 1.88 | % |
| January 1, 2025 through July 1, 2026 | | 2.50 | % |
Future capital requirements
Our future capital requirements depend on many factors as noted throughout this report. We believe that, based on our current level of operations and related cash flows, plus cash on hand and available borrowings under our revolving credit facility, we will be able to meet our liquidity needs for the next 12 months and the foreseeable future.
For fiscal 2024, we expect our capital expenditures to approximate 3.5% to 4.0% of revenue. Additionally, we will be required to pay $10.2 million in principal payments and approximately $7.0 million in interest payments on our long-term debt in the next 12 months. Our estimate of interest expense above was derived from our variable interest rates at March 31, 2023, and is subject to change. See further details Note 12, "Long-Term Debt." We also have payment commitments of $1.6 million, mostly related to long-term information technology contracts, of which $1.5 million are due within the next 12 months.
| | | | | | | | | | | | | | | | | |
| Year Ended March 31, |
| (Dollars in thousands) | 2023 | | 2022 | | 2021 |
| Total cash provided by/(used in): | | | | | |
| Operating activities | $ | 57,714 | | | $ | 28,754 | | | $ | 30,289 | |
| Investing activities | (44,555) | | | (4,531) | | | (7,832) | |
| Financing activities | (13,465) | | | (22,658) | | | (28,205) | |
| | | | | |
Free Cash Flow(1) | | | | | |
| Cash provided by operating activities | $ | 57,714 | | | $ | 28,754 | | | $ | 30,289 | |
| Less: Cash used for purchases of property, plant, and equipment | (9,453) | | | (5,220) | | | (8,132) | |
| Plus: Sales of rental equipment | 197 | | | 689 | | | 300 | |
| Free Cash Flow | $ | 48,458 | | | $ | 24,223 | | | $ | 22,457 | |
| | | | | |
(1) "Free Cash Flow" is a non-GAAP financial measure, which we define as net cash provided by operating activities less cash used for the purchase of property, plant, and equipment, net of sales of rental equipment and proceeds from sales of land and buildings. Free Cash Flow is one measure management uses internally to assess liquidity. Our calculation may not be comparable to similarly titled measures reported by other companies. See further discussion of Non-GAAP Financial Measures below.
Year Ended March 31, 2023 ("fiscal 2023") Compared to the Year Ended March 31, 2022 ("fiscal 2022")
Net cash provided by/(used in) operating activities. Net cash provided by operating activities increased versus fiscal 2022. The increase is mostly attributable to better relative performance in our working capital accounts of $19.9 million, and strong change in net income in the fiscal year of $13.6 million, partially offset by relatively less cash provided by other miscellaneous items of $4.5 million.
Net cash provided by/(used in) investing activities. Activity in fiscal 2023 relates to borrowing for the acquisition of Powerblanket, as well as increased purchasing of fixed assets, primarily to maintain the existing operations of the business plus purchases and sales of equipment in our rental business.
Net cash provided by/(used in) financing activities. The comparative decrease in the use of cash in financing activities mostly attributable to higher principal payments on our revolving credit facilities and term loans, though these were more than offset by increased proceeds from our revolving credit facility in fiscal 2023 compared to fiscal 2022. The revolving credit facility was used to fund our acquisition of Powerblanket.
Free Cash Flow (Non-GAAP)
In addition to evaluating our cash flow generation based upon operating, investing, and financing activities, the Company believes that Free Cash Flow as used in this section may provide investors and key stakeholders with another important perspective regarding our performance. The Company does not intend for this non-GAAP metric to be a substitute for the related GAAP measure, nor should it be viewed in isolation and without considering all relevant GAAP measurements. Moreover, our calculation may not be comparable to similarly titled measures reported by other companies. Refer to the reconciliation of cash provided by/(used in) operating activities to Free Cash Flow under "Non-GAAP Financial Measures" above.
We define “Free Cash Flow” as net cash provided by operating activities less cash used for the purchase of property, plant, and equipment, net of sales of rental equipment as well as proceeds from sales of land and buildings. This metric should not be interpreted to mean the remaining cash that is available for discretionary spending, dividends, share repurchases, acquisitions, or other purposes, as it excludes significant, mandatory obligations, such as principal payments on the Company’s long-term debt facility. Free cash flow is one measure that the Company uses internally to assess liquidity.
Free Cash Flow totaled $48.5 million for fiscal 2023 as compared to $24.2 million for fiscal 2022, an increase comparatively, primarily due to higher cash flows from operations. Free Cash Flow for fiscal 2021 was $22.5 million driven primarily by strong cash flows from operating activities.
Year Ended March 31, 2022 ("fiscal 2022") Compared to the Year Ended March 31, 2021 ("fiscal 2021")
See Item 7, “Management’s Discussion and Analysis of Financial Condition and Results of Operations” in our Annual Report on Form 10-K for the fiscal year ended March 31, 2022 filed with the SEC on May 26, 2022 for a discussion of net cash provided by operating activities, net cash used in investing activities and net cash provided by (used in) financing activities in fiscal 2022 as compared to fiscal 2021.
Off-Balance Sheet Arrangements
We do not have any off-balance sheet arrangements. In addition, we do not have any interest in entities commonly referred to as variable interest entities, which include special purpose entities and other structured finance entities.
Critical Accounting Policies and Estimates
The preparation of our financial statements in accordance with U.S. GAAP requires us to make estimates and assumptions that affect the reported amounts of assets, liabilities, revenues, expenses and related disclosures of contingent assets and liabilities. We base our estimates on past experience and other assumptions that we believe are reasonable under the circumstances, and we evaluate these estimates on an ongoing basis. Our critical accounting policies are those that materially affect our financial statements and involve difficult, subjective or complex judgments by management. Our most significant financial statement estimates include revenue recognition, valuation of goodwill and other intangible assets, and accounting for income taxes.
Although these estimates are based on management's best knowledge of current events and actions that may impact the company in the future, actual results may be materially different from the estimates.
Revenue recognition. Refer to Note 1, "Organization and Summary of Significant Accounting Policies" of our consolidated financial statements included below in Item 8 of this annual report for further discussion.
Valuation of goodwill and other intangible assets. Refer to Note 1, "Organization and Summary of Significant Accounting Policies" of our consolidated financial statements included below in Item 8 of this annual report for further discussion.
Accounting for income taxes. Refer to Note 1, "Organization and Summary of Significant Accounting Policies" of our consolidated financial statements included below in Item 8 of this annual report for further discussion.
Non-GAAP Financial Measures
Disclosure in this annual report of "Adjusted EPS," "Adjusted EBITDA," "Adjusted Net Income," and "Free Cash Flow," which are "non-GAAP financial measures" as defined under the rules of the Securities and Exchange Commission (the "SEC"), are intended as supplemental measures of our financial performance that are not required by, or presented in accordance with, U.S. generally accepted accounting principles ("GAAP"). "Adjusted Net Income" and "Adjusted fully diluted earnings per share" ("Adjusted EPS") represents net income attributable to Thermon before costs related to acceleration of unamortized debt costs, the tax benefit from income tax rate reductions in certain foreign jurisdictions, withholding tax on dividend related to the debt amendment, amortization of intangible assets, transaction-related costs, the income tax effect on any non-tax adjustments, costs associated with our restructuring and other income/(charges), other impairment charges/(income), loss on debt extinguishment, and income related to the Canadian Emergency Wage Subsidy, per fully-diluted common share in the case of Adjusted EPS. "Adjusted EBITDA" represents net income attributable to Thermon before interest expense (net of interest income), income tax expense, depreciation and amortization expense, stock-based compensation expense, impairment and other charges/(income), loss on debt extinguishment, costs associated with our restructuring and other income/(charges), and income related to the Canadian Emergency Wage Subsidy. "Free cash flow" represents cash provided by operating activities less cash used for the purchase of property, plant and equipment, net of sales of rental equipment and proceeds from sales of land and buildings.
We believe these non-GAAP financial measures are meaningful to our investors to enhance their understanding of our financial performance and are frequently used by securities analysts, investors and other interested parties to compare our performance with the performance of other companies that report Adjusted EPS, Adjusted EBITDA, or Adjusted Net Income. Adjusted EPS, Adjusted EBITDA, and Adjusted Net Income should be considered in addition to, not as substitutes for, income from operations, net income, net income per share, and other measures of financial performance reported in accordance with GAAP. We provide Free Cash Flow as one measure of our liquidity. Note that our calculation of Adjusted EPS, Adjusted EBITDA, Adjusted Net Income, and Free Cash Flow may not be comparable to similarly titled measures reported by other companies.
The following table reconciles net income/(loss) to Adjusted EBITDA for the periods presented:
| | | | | | | | | | | | | | | | | |
| Year Ended March 31, |
| (Dollars in thousands) | 2023 | | 2022 | | 2021 |
| Net income/(loss) | $ | 33,666 | | | $ | 20,092 | | | $ | 877 | |
| Interest expense, net | 5,871 | | | 5,815 | | | 10,185 | |
| Income tax expense/(benefit) | 15,567 | | | 8,333 | | | (1,521) | |
| Depreciation and amortization | 19,231 | | | 20,205 | | | 20,722 | |
| EBITDA (non-GAAP) | $ | 74,335 | | | $ | 54,445 | | | $ | 30,263 | |
| Stock-based compensation | 5,954 | | | 3,803 | | | 3,728 | |
| Transaction-related costs | 335 | | | — | | | — | |
| Restructuring and other charges/(income) | 3,693 | | | (414) | | | 8,623 | |
| Impairment and other charges/(income) | 8,945 | | | — | | | — | |
| Loss on debt extinguishment | — | | | 2,569 | | | — | |
| Canadian Emergency Wage Subsidy | — | | | (1,952) | | | (6,412) | |
| Adjusted EBITDA (non-GAAP) | $ | 93,262 | | | $ | 58,451 | | | $ | 36,202 | |
The following table reconciles net income/(loss) to Adjusted Net Income and Adjusted EPS for the periods presented:
| | | | | | | | | | | | | | | | | | | | |
| | Year ended March 31, |
| (Dollars in thousands, except per share data) | 2023 | | 2022 | | 2021 |
| Net income/(loss) | $ | 33,666 | | | $ | 20,092 | | | $ | 877 | |
| Acceleration of unamortized debt costs | — | | | — | | | 510 | |
| Tax expense/(benefit) for impact of rate reduction in foreign jurisdictions | — | | | 505 | | | 332 | |
| Withholding tax on dividend related to debt amendment | — | | | 301 | | | — | |
| Amortization of intangible assets | 9,447 | | | 8,790 | | | 9,445 | |
| Transaction-related costs | 335 | | | — | | | — | |
| Restructuring and other charges/(income) | 3,693 | | | (414) | | | 8,623 | |
| Impairment and other charges/(income) | 8,945 | | | — | | | — | |
| Loss on debt extinguishment | — | | | 2,569 | | | — | |
| Canadian Emergency Wage Subsidy | — | | | (1,952) | | | (6,412) | |
| Tax effect of financial adjustments | (3,307) | | | (1,999) | | | (2,450) | |
| Adjusted net income (non-GAAP) | $ | 52,779 | | | $ | 27,892 | | | $ | 10,925 | |
| | | | | | |
| Adjusted-fully diluted earnings per common share (non-GAAP) | $ | 1.56 | | | $ | 0.83 | | | $ | 0.33 | |
| | | | | | |
| Fully-diluted common shares - non-GAAP basis (thousands) | 33,746 | | | 33,515 | | | 33,341 | |
ITEM 7A. QUANTITATIVE AND QUALITATIVE DISCLOSURES ABOUT MARKET RISK
Our primary market risk exposures include the effect of fluctuations in foreign exchange rates, interest rates and commodity prices.
Foreign currency risk relating to operations. We transact business globally and are subject to risks associated with fluctuating foreign exchange rates. Approximately 56% of our fiscal 2023 consolidated revenues were generated by sales from our non-U.S. subsidiaries. Our non-U.S. subsidiaries generally sell their products and services in the local currency, but obtain a significant amount of their products from our manufacturing facilities located elsewhere, primarily the United States, Canada and Europe. Significant changes in the relevant exchange rates could adversely affect our margins on foreign sales of products. Our non-U.S. subsidiaries incur most of their expenses (other than intercompany expenses) in their local functional currency. These currencies include the Canadian Dollar, Euro, British Pound, Russian Ruble, Australian Dollar, South Korean Won, Chinese Renminbi, Indian Rupee, Mexican Peso, and Japanese Yen.
We have established a program that primarily utilizes foreign currency forward contracts to offset the risk associated with the effects of certain foreign currency exposures. Under this program, increases or decreases in our foreign currency exposures are offset by gains or losses on the forward contracts, to mitigate the possibility of foreign currency transaction gains or losses. These foreign currency exposures typically arise from intercompany transactions. Our forward contracts generally have terms of 30 days or less. We do not use forward contracts for trading purposes nor do we designate these forward contracts as hedging instruments pursuant to Accounting Standards Codification ("ASC") Topic 815, Derivatives and Hedging. We adjust the carrying amount of all contracts to their fair value at the end of each reporting period and unrealized gains and losses are included in our results of operations for that period. These gains and losses largely offset gains and losses resulting from settlement of payments received from our foreign operations which are settled in U.S. dollars. All outstanding foreign currency forward contracts are marked to market at the end of the period with unrealized gains and losses included in Other income/(expense). The fair value is determined by quoted prices on identical forward contracts (Level 2 fair value). The balance sheet reflects unrealized gains within accounts receivable and unrealized losses within accrued liabilities. Our ultimate realized gain or loss with respect to currency fluctuations will depend on the currency exchange rates and other factors in effect as the contracts mature. As of March 31, 2023 and 2022, the notional amounts of forward contracts we held to buy U.S. dollars in exchange for other major international currencies were $7.0 million and $7.3 million, respectively.
During fiscal 2023, our largest exposures to foreign exchange rates consisted primarily of the Canadian Dollar and the Euro against the U.S. dollar. The market risk related to the foreign currency exchange rates is measured by estimating the potential impact of a 10% change in the value of the U.S. dollar relative to the local currency exchange rates. The rates used to perform this analysis were based on a weighted average of the market rates in effect during the relevant period. A 10% appreciation of the U.S. dollar relative to the Canadian Dollar would result in a net decrease in net income of $2.2 million for fiscal 2023. Conversely, a 10% depreciation of the U.S. dollar relative to the Canadian Dollar would result in a net increase in net income of $2.7 million for fiscal 2023. A 10% appreciation of the U.S. dollar relative to the Euro would result in a net decrease in net income of $0.1 million for fiscal 2023. Conversely, a 10% depreciation of the U.S. dollar relative to the Euro would result in a net increase in net income of $0.1 million for fiscal 2023.
The geographic areas outside the United States in which we operate are generally not considered to be highly inflationary. Nonetheless, these foreign operations are sensitive to fluctuations in currency exchange rates arising from, among other things, certain intercompany transactions that are generally denominated in U.S. dollars rather than their respective functional currencies. The impact of foreign currency transactions on our consolidated statements of operations were losses of $0.1 million and losses of $1.9 million in fiscal 2023 and fiscal 2022, respectively.
Because our consolidated financial results are reported in U.S. dollars, and we generate a substantial amount of our sales and earnings in other currencies, the translation of those results into U.S. dollars can result in a significant increase or decrease in the amount of those sales and earnings. In addition, fluctuations in currencies relative to the U.S. dollar may make it more difficult to perform period-to-period comparisons of our reported results of operations. In fiscal 2023, we estimate that our sales were negatively impacted by $15.1 million when compared to foreign exchange translation rates that were in effect in fiscal 2022. Foreign currency impact on revenue is calculated by comparing actual current period revenue in U.S. dollars to theoretical U.S. Dollar revenue we would have achieved based on the weighted-average foreign exchange rates in effect in the comparative prior periods for all applicable foreign currencies. At each balance sheet date, we translate our assets and liabilities denominated in foreign currency to U.S. dollars. The balances of our foreign equity accounts are translated at their historical value. The difference between the current rates and the historical rates are posted to our currency translation account and reflected in the shareholders' equity section of our balance sheet. The effect of foreign currency translation were losses of $19.2 million in fiscal 2023 and $2.9 million in fiscal 2022. In fiscal 2022, we were primarily impacted by the appreciation of the Canadian Dollar relative to the U.S. dollar. Currency translation gains or losses are reported as part of comprehensive income or loss in our accompanying consolidated financial statements.
Foreign currency risks related to intercompany notes. The Company exited a cross currency swap during fiscal 2022 and did not have a similar arrangement in fiscal 2023. Refer to Note 3, "Fair Value Measurements" for more information. Also, refer to Item 1A, "Risk Factors" for further discussion regarding our risk as it relates to foreign currency.
Interest rate risk and foreign currency risk relating to debt. Borrowings under both our variable rate term loan A credit facility and revolving credit facility incur interest expense that is variable in relation to the SOFR rate. The interest rate for borrowings under our term loan A credit facility was 5.59% for the U.S. Term Loan, 6.16% for the U.S. revolving credit facility, and 6.27% for the Canadian Term loan as of March 31, 2023. Based on historical balances on our revolving credit facility, we do not anticipate that a one percent increase or decrease in our interest rate would have a significant impact on our operations. We cannot provide any assurances that historical revolver borrowings will be reflective of our future use of the revolving credit facility. As of March 31, 2023, we had $14.5 million outstanding principal under our revolving credit facility.
As of March 31, 2023, we had $98.4 million of outstanding principal under our variable rate SOFR-based term loan B credit facility. Based on the outstanding borrowings, a one percent change in the interest rate would result in a $1.0 million increase or decrease in our annual interest expense.
Commodity price risk. We use various commodity-based raw materials in our manufacturing processes. Generally, we acquire such components at market prices and do not typically enter into long-term purchase commitments with suppliers or hedging instruments to mitigate commodity price risk. As a result, we are subject to market risks related to changes in commodity prices and supplies of key components of our products. Historically, the costs of our primary raw materials have been stable and readily available from multiple suppliers. Typically, we have been able to pass on raw material cost increases to our customers. We cannot provide any assurance, however, that we may be able to pass along such cost increases to our customers or source sufficient amounts of key components on commercially reasonable terms or at all in the future, and if we are unable to do so, our results of operations may be adversely affected.
ITEM 8. FINANCIAL STATEMENTS AND SUPPLEMENTARY DATA
INDEX TO FINANCIAL STATEMENTS
| | | | | |
| Page |
| Audited Financial Statements of Thermon Group Holdings, Inc. and its Consolidated Subsidiaries | |
| |
| |
| |
| |
| |
| |
Report of Independent Registered Public Accounting Firm
To the Stockholders and Board of Directors
Thermon Group Holdings, Inc.:
Opinion on the Consolidated Financial Statements
We have audited the accompanying consolidated balance sheets of Thermon Group Holdings, Inc. and subsidiaries (the Company) as of March 31, 2023 and 2022, the related consolidated statements of operations and comprehensive income/(loss), equity, and cash flows for each of the years in the three-year period ended March 31, 2023, and the related notes (collectively, the consolidated financial statements). In our opinion, the consolidated financial statements present fairly, in all material respects, the financial position of the Company as of March 31, 2023 and 2022, and the results of its operations and its cash flows for each of the years in the three-year period ended March 31, 2023, in conformity with U.S. generally accepted accounting principles.
We also have audited, in accordance with the standards of the Public Company Accounting Oversight Board (United States) (PCAOB), the Company’s internal control over financial reporting as of March 31, 2023, based on criteria established in Internal Control – Integrated Framework (2013) issued by the Committee of Sponsoring Organizations of the Treadway Commission, and our report dated May 25, 2023 expressed an unqualified opinion on the effectiveness of the Company’s internal control over financial reporting.
Basis for Opinion
These consolidated financial statements are the responsibility of the Company’s management. Our responsibility is to express an opinion on these consolidated financial statements based on our audits. We are a public accounting firm registered with the PCAOB and are required to be independent with respect to the Company in accordance with the U.S. federal securities laws and the applicable rules and regulations of the Securities and Exchange Commission and the PCAOB.
We conducted our audits in accordance with the standards of the PCAOB. Those standards require that we plan and perform the audit to obtain reasonable assurance about whether the consolidated financial statements are free of material misstatement, whether due to error or fraud. Our audits included performing procedures to assess the risks of material misstatement of the consolidated financial statements, whether due to error or fraud, and performing procedures that respond to those risks. Such procedures included examining, on a test basis, evidence regarding the amounts and disclosures in the consolidated financial statements. Our audits also included evaluating the accounting principles used and significant estimates made by management, as well as evaluating the overall presentation of the consolidated financial statements. We believe that our audits provide a reasonable basis for our opinion.
Critical Audit Matter
The critical audit matter communicated below is a matter arising from the current period audit of the consolidated financial statements that was communicated or required to be communicated to the audit committee and that: (1) relates to accounts or disclosures that are material to the consolidated financial statements and (2) involved our especially challenging, subjective, or complex judgments. The communication of a critical audit matter does not alter in any way our opinion on the consolidated financial statements, taken as a whole, and we are not, by communicating the critical audit matter below, providing a separate opinion on the critical audit matter or on the accounts or disclosures to which it relates.
Sufficiency of audit evidence surrounding revenues of certain projects recognized over time using cost-to-cost percentage of completion
As discussed in Note 5 to the consolidated financial statements, the Company recognized $163,291 thousand of revenues over time using cost-to-cost percentage of completion or time and materials methodologies, for the year ended March 31, 2023.
We identified the evaluation of the sufficiency of audit evidence related to revenues of certain projects recognized over time using cost-to-cost percentage of completion as a critical audit matter. A high degree of subjective auditor judgment was required because of the geographical dispersion of the Company’s revenue generating activities and the extensive data compilation required to sufficiently support the revenue recognition.
The following are the primary procedures we performed to address this critical audit matter. We applied auditor judgment to determine the nature and extent of procedures to be performed over the revenue stream. We evaluated the design and tested the effectiveness of certain internal controls over the Company’s revenue recognition process, including controls associated with contract setup, project cost accumulation, monitoring of project status, and estimated costs to complete. We assessed the recorded revenues of certain projects by selecting certain projects and comparing the amounts recognized for consistency with underlying documentation, including contracts with
customers, cost accumulation data, estimated costs to complete, and project status assessments by the project managers. In addition, we evaluated the sufficiency of audit evidence obtained over revenues of certain projects recognized over time using cost-to-cost percentage of completion by assessing the results of procedures performed.
/s/ KPMG LLP
We have served as the Company’s auditor since 2013.
Austin, Texas
May 25, 2023
Report of Independent Registered Public Accounting Firm
To the Stockholders and Board of Directors
Thermon Group Holdings, Inc.:
Opinion on Internal Control Over Financial Reporting
We have audited Thermon Group Holdings, Inc. and subsidiaries' (the Company) internal control over financial reporting as of March 31, 2023, based on criteria established in Internal Control – Integrated Framework (2013) issued by the Committee of Sponsoring Organizations of the Treadway Commission. In our opinion, the Company maintained, in all material respects, effective internal control over financial reporting as of March 31, 2023, based on criteria established in Internal Control – Integrated Framework (2013) issued by the Committee of Sponsoring Organizations of the Treadway Commission.
We also have audited, in accordance with the standards of the Public Company Accounting Oversight Board (United States) (PCAOB), the consolidated balance sheets of the Company as of March 31, 2023 and 2022, the related consolidated statements of operations and comprehensive income/(loss), equity, and cash flows for each of the years in the three-year period ended March 31, 2023, and the related notes (collectively, the consolidated financial statements), and our report dated May 25, 2023 expressed an unqualified opinion on those consolidated financial statements.
The Company acquired 100% of the issued and outstanding equity interests of Flatwork Technologies LLC, GreenHeat IP Holdings, LLC, WarmGuard, LLC, and Heat Authority, LLC (collectively, “Powerblanket”) during the year ended March 31, 2023, and management excluded from its assessment of the effectiveness of the Company’s internal control over financial reporting as of March 31, 2023, Powerblanket’s internal control over financial reporting associated with total assets and total revenues of approximately 6% and 4%, respectively, of the consolidated financial statements of the Company as of and for the year ended March 31, 2023. Our audit of internal control over financial reporting of the Company also excluded an evaluation of the internal control over financial reporting of Powerblanket.
Basis for Opinion
The Company’s management is responsible for maintaining effective internal control over financial reporting and for its assessment of the effectiveness of internal control over financial reporting, included in the accompanying Management's Annual Report on Internal Control Over Financial Reporting. Our responsibility is to express an opinion on the Company’s internal control over financial reporting based on our audit. We are a public accounting firm registered with the PCAOB and are required to be independent with respect to the Company in accordance with the U.S. federal securities laws and the applicable rules and regulations of the Securities and Exchange Commission and the PCAOB.
We conducted our audit in accordance with the standards of the PCAOB. Those standards require that we plan and perform the audit to obtain reasonable assurance about whether effective internal control over financial reporting was maintained in all material respects. Our audit of internal control over financial reporting included obtaining an understanding of internal control over financial reporting, assessing the risk that a material weakness exists, and testing and evaluating the design and operating effectiveness of internal control based on the assessed risk. Our audit also included performing such other procedures as we considered necessary in the circumstances. We believe that our audit provides a reasonable basis for our opinion.
Definition and Limitations of Internal Control Over Financial Reporting
A company’s internal control over financial reporting is a process designed to provide reasonable assurance regarding the reliability of financial reporting and the preparation of financial statements for external purposes in accordance with generally accepted accounting principles. A company’s internal control over financial reporting includes those policies and procedures that (1) pertain to the maintenance of records that, in reasonable detail, accurately and fairly reflect the transactions and dispositions of the assets of the company; (2) provide reasonable assurance that transactions are recorded as necessary to permit preparation of financial statements in accordance with generally accepted accounting principles, and that receipts and expenditures of the company are being made only in accordance with authorizations of management and directors of the company; and (3) provide reasonable assurance regarding prevention or timely detection of unauthorized acquisition, use, or disposition of the company’s assets that could have a material effect on the financial statements.
Because of its inherent limitations, internal control over financial reporting may not prevent or detect misstatements. Also, projections of any evaluation of effectiveness to future periods are subject to the risk that controls may become inadequate because of changes in conditions, or that the degree of compliance with the policies or procedures may deteriorate.
/s/ KPMG LLP
Austin, Texas
May 25, 2023
Thermon Group Holdings, Inc.
Consolidated Statements of Operations and Comprehensive Income/(Loss)
(Dollars in thousands, except share and per share data)
| | | | | | | | | | | | | | | | | | | | |
| | Year Ended March 31, 2023 | | Year Ended March 31, 2022 | | Year Ended March 31, 2021 |
| Sales | | $ | 440,590 | | | $ | 355,674 | | | $ | 276,181 | |
| Cost of sales | | 255,465 | | | 215,556 | | | 159,309 | |
| Gross profit | | 185,125 | | | 140,118 | | | 116,872 | |
| Operating expenses: | | | | | | |
| Selling, general and administrative expenses | | 117,003 | | | 93,054 | | | 89,834 | |
| Deferred compensation plan expense/(income) | | (208) | | | 283 | | | 1,564 | |
| Amortization of intangible assets | | 9,447 | | | 8,790 | | | 9,445 | |
| Restructuring and other charges/(income) | | 3,693 | | | (414) | | | 8,623 | |
| Income/(loss) from operations | | 55,190 | | | 38,405 | | | 7,406 | |
| Other income/(expenses): | | | | | | |
| Interest expense, net | | (5,871) | | | (5,815) | | | (10,185) | |
| Other income/(expense) | | (86) | | | (4,165) | | | 2,135 | |
| Income/(loss) before provision for income taxes | | 49,233 | | | 28,425 | | | (644) | |
| Income tax expense/(benefit) | | 15,567 | | | 8,333 | | | (1,521) | |
| Net income/(loss) | | 33,666 | | | 20,092 | | | 877 | |
| Other comprehensive income/(loss): | | | | | | |
| Net income/(loss) | | $ | 33,666 | | | $ | 20,092 | | | $ | 877 | |
| Foreign currency translation adjustment | | (19,202) | | (2,922) | | | 28,615 | |
| Other | | 8 | | | (65) | | | (640) | |
| Total comprehensive income/(loss) | | $ | 14,472 | | | $ | 17,105 | | | $ | 28,852 | |
| Net income/(loss) per common share: | | | | | | |
| Basic | | $ | 1.01 | | | $ | 0.60 | | | $ | 0.03 | |
| Diluted | | 1.00 | | | 0.60 | | | 0.03 | |
| Weighted-average shares used in computing net income/(loss) per common share: | | | | | | |
| Basic | | 33,468,632 | | | 33,308,045 | | | 33,134,592 | |
| Diluted | | 33,745,936 | | | 33,514,561 | | | 33,340,954 | |
The accompanying notes are an integral part of these consolidated financial statements
Thermon Group Holdings, Inc.
Consolidated Balance Sheets
(Dollars in thousands, except share and per share data)
| | | | | | | | | | | |
| | March 31,
2023 | | March 31,
2022 |
| Assets | | | |
| Current assets: | | | |
| Cash and cash equivalents | $ | 35,635 | | | $ | 41,445 | |
| | | |
| Accounts receivable, net of allowances of $2,682 and $2,177 as of March 31, 2023 and 2022, respectively | 97,627 | | | 95,305 | |
| Inventories, net | 82,132 | | | 71,650 | |
| Contract assets | 16,272 | | | 19,626 | |
| Prepaid expenses and other current assets | 16,138 | | | 11,786 | |
| Income tax receivable | 3,138 | | | 4,626 | |
| Total current assets | $ | 250,942 | | | $ | 244,438 | |
| Property, plant and equipment, net of depreciation and amortization of $67,450 and $63,954 as of March 31, 2023 and 2022, respectively | 63,288 | | | 66,039 | |
| Goodwill | 219,612 | | | 212,754 | |
| Intangible assets, net | 93,970 | | | 94,908 | |
| Operating lease right-of-use assets | 13,570 | | | 10,534 | |
| Deferred income taxes | 688 | | | 1,211 | |
| Other non-current assets | 7,559 | | | 6,785 | |
| Total assets | $ | 649,629 | | | $ | 636,669 | |
| Liabilities and equity | | | |
| Current liabilities: | | | |
| Accounts payable | $ | 27,330 | | | $ | 33,567 | |
| Accrued liabilities | 39,364 | | | 26,971 | |
| Current portion of long-term debt | 10,222 | | | 7,929 | |
| Borrowings under revolving credit facility | 14,500 | | | — | |
| Contract liabilities | 8,483 | | | 8,010 | |
| Lease liabilities | 3,364 | | | 3,624 | |
| Income taxes payable | 6,809 | | | 897 | |
| Total current liabilities | $ | 110,072 | | | $ | 80,998 | |
| Long-term debt, net of current maturities and deferred debt issuance costs of $429 and $640 as of March 31, 2023 and 2022, respectively | 87,710 | | | 120,431 | |
| Deferred income taxes | 12,084 | | | 17,943 | |
| Non-current lease liabilities | 12,479 | | | 9,659 | |
| Other non-current liabilities | 8,296 | | | 8,434 | |
| Total liabilities | $ | 230,641 | | | $ | 237,465 | |
| Equity | | | |
| Common stock: $.001 par value; 150,000,000 authorized; 33,508,076 and 33,364,722 shares issued and outstanding at March 31, 2023 and 2022, respectively | 33 | | | 33 | |
| Preferred stock: $.001 par value; 10,000,000 authorized; no shares issued and outstanding | — | | | — | |
| Additional paid-in capital | 239,860 | | | 234,549 | |
| Accumulated other comprehensive loss | (58,100) | | | (38,906) | |
| Retained earnings | 237,195 | | | 203,528 | |
| | | |
| | | |
| Total equity | $ | 418,988 | | | $ | 399,204 | |
| Total liabilities and equity | $ | 649,629 | | | $ | 636,669 | |
The accompanying notes are an integral part of these consolidated financial statements
Thermon Group Holdings, Inc.
Consolidated Statements of Equity
(Dollars in thousands, except share and per share data)
| | | | | | | | | | | | | | | | | | | | | | | | | | | | | | | | | | | | | | | | | |
| | | Common Stock Outstanding | | Common Stock | | Additional Paid-in Capital | | Retained Earnings | | Accumulated Other Comprehensive Income (Loss) | | Total |
| Balances at March 31, 2020 | 32,916,818 | | | $ | 33 | | | $ | 227,741 | | | $ | 182,559 | | | $ | (63,894) | | | $ | 346,439 | |
| Issuance of common stock in exercise of stock options | 97,156 | | | — | | | 629 | | | — | | | — | | | 629 | |
| Issuance of restricted stock as deferred compensation to directors | 52,098 | | | — | | | — | | | — | | | — | | | — | |
| Issuance of common stock as deferred compensation to employees | 88,254 | | | — | | | — | | | — | | | — | | | — | |
| Issuance of common stock as deferred compensation to named executive officers | 71,482 | | | — | | | — | | | — | | | — | | | — | |
| Stock compensation expense | — | | | — | | | 3,728 | | | — | | | — | | | 3,728 | |
| | | | | | | | | | | |
| Repurchase of employee stock units on vesting | — | | | — | | | (784) | | | — | | | — | | | (784) | |
| Net income/(loss) | — | | | — | | | — | | | 877 | | | — | | | 877 | |
| Foreign currency translation adjustment | — | | | — | | | — | | | — | | | 28,615 | | | 28,615 | |
| | | | | | | | | | | |
| Other | — | | | — | | | 8 | | | — | | | (640) | | | (632) | |
| | | | | | | | | | | |
| | | | | | | | | | | |
| | | | | | | | | | | |
| | | | | | | | | | | |
| Balances at March 31, 2021 | 33,225,808 | | | $ | 33 | | | $ | 231,322 | | | $ | 183,436 | | | $ | (35,919) | | | $ | 378,872 | |
| Issuance of common stock in exercise of stock options | 8,100 | | | — | | | 97 | | | — | | | — | | | 97 | |
| Issuance of common stock as deferred compensation to directors | 32,136 | | | — | | | — | | | — | | | — | | | — | |
| Issuance of common stock as deferred compensation to employees | 36,126 | | | — | | | — | | | — | | | — | | | — | |
| Issuance of common stock as deferred compensation to executive officers | 62,552 | | | — | | | — | | | — | | | — | | | — | |
| Stock compensation expense | — | | | — | | | 3,803 | | | — | | | — | | | 3,803 | |
| | | | | | | | | | | |
| Repurchase of employee stock units on vesting | — | | | — | | | (673) | | | — | | | — | | | (673) | |
| Net income/(loss) | — | | | — | | | — | | | 20,092 | | | — | | | 20,092 | |
| Foreign currency translation adjustment | — | | | — | | | — | | | — | | | (2,922) | | | (2,922) | |
| Other | — | | | — | | | — | | | — | | | (65) | | | (65) | |
| Balances at March 31, 2022 | 33,364,722 | | | $ | 33 | | | $ | 234,549 | | | $ | 203,528 | | | $ | (38,906) | | | $ | 399,204 | |
| | | | | | | | | | | |
| Issuance of common stock as deferred compensation to directors | 38,137 | | | — | | | — | | | — | | | — | | | — | |
| Issuance of common stock as deferred compensation to employees | 40,923 | | | — | | | — | | | — | | | — | | | — | |
| Issuance of common stock as deferred compensation to executive officers | 64,294 | | | — | | | — | | | — | | | — | | | — | |
| Stock compensation expense | — | | | — | | | 5,954 | | | — | | | — | | | 5,954 | |
| Repurchase of employee stock units on vesting | — | | | — | | | (643) | | | — | | | — | | | (643) | |
| Net income/(loss) | — | | | — | | | — | | | 33,666 | | | — | | | 33,666 | |
| | | | | | | | | | | |
| Foreign currency translation adjustment | — | | | — | | | — | | | — | | | (19,202) | | | (19,202) | |
| Other | — | | | — | | | — | | | 1 | | | 8 | | | 9 | |
| | | | | | | | | | | |
| | | | | | | | | | | |
| | | | | | | | | | | |
| Balances at March 31, 2023 | 33,508,076 | | | $ | 33 | | | $ | 239,860 | | | $ | 237,195 | | | $ | (58,100) | | | $ | 418,988 | |
The accompanying notes are an integral part of these consolidated financial statements
Thermon Group Holdings, Inc.
Consolidated Statements of Cash Flows
(Dollars in thousands) | | | | | | | | | | | | | | | | | |
| Year Ended March 31, 2023 | | Year Ended March 31, 2022 | | Year Ended March 31, 2021 |
| Operating activities | | | | | |
| Net income/(loss) | $ | 33,666 | | | $ | 20,092 | | | $ | 877 | |
| Adjustment to reconcile net income/(loss) to net cash provided by operating activities: | | | | | |
| Depreciation and amortization | 19,231 | | | 20,205 | | | 20,722 | |
| Amortization of debt costs | 317 | | | 596 | | | 1,525 | |
| Loss on extinguishment of debt | — | | | 2,569 | | | — | |
| Impairment of property, plant, and equipment | 298 | | | — | | | — | |
| Stock compensation expense | 5,954 | | | 3,803 | | | 3,728 | |
| Loss on sale of business, net of cash surrendered | — | | | 306 | | | 2,065 | |
| Deferred income taxes | (4,562) | | | (1,648) | | | (3,153) | |
| Long-term cross currency swap loss/(gain) | — | | | (774) | | | 5,842 | |
| Reserve (release) for uncertain tax positions | 36 | | | 77 | | | 79 | |
| Remeasurement loss/(gain) on intercompany balances | (914) | | | (247) | | | (6,227) | |
| Changes in operating assets and liabilities: | | | | | |
| Accounts receivable | (2,912) | | | (21,739) | | | 22,930 | |
| Inventories | (8,839) | | | (8,598) | | | (549) | |
| Contract assets | 4,051 | | | (3,292) | | | (2,693) | |
| Other current and non-current assets | 57 | | | (2,891) | | | (2,127) | |
| Accounts payable | (7,119) | | | 13,752 | | | (5,651) | |
| Accrued liabilities and non-current liabilities | 11,147 | | | 2,227 | | | (239) | |
| Income taxes payable and receivable | 7,303 | | | 4,316 | | | (6,840) | |
| Net cash provided by operating activities | $ | 57,714 | | | $ | 28,754 | | | $ | 30,289 | |
| Investing activities | | | | | |
| Purchases of property, plant and equipment | $ | (9,453) | | | $ | (5,220) | | | $ | (8,132) | |
| Sales of rental equipment | 197 | | | 689 | | | 300 | |
| Cash paid for acquisitions, net of cash acquired | (35,299) | | | — | | | — | |
| Net cash used in investing activities | $ | (44,555) | | | $ | (4,531) | | | $ | (7,832) | |
| Financing activities | | | | | |
| Proceeds from Term Loan A | $ | — | | | $ | 139,793 | | | $ | — | |
| Payments on Term Loan A | (27,180) | | | (170,780) | | | (57,499) | |
| Proceeds from revolving credit facility | 34,500 | | | 18,459 | | | 37,189 | |
| Payments on revolving credit facility | (20,000) | | | (8,134) | | | (7,464) | |
| Issuance costs associated with debt financing | — | | | (1,265) | | | — | |
| Lease financing | (142) | | | (155) | | | (276) | |
| Issuance of common stock including exercise of stock options | — | | | 97 | | | 629 | |
| Repurchase of employee stock units on vesting | (643) | | | (673) | | | (784) | |
| Net cash used in financing activities | $ | (13,465) | | | $ | (22,658) | | | $ | (28,205) | |
| Less: Net change in cash balances classified as assets held-for-sale | (3,939) | | | — | | | — | |
| Effect of exchange rate changes on cash and cash equivalents | (1,166) | | | (84) | | | 2,192 | |
| Change in cash and cash equivalents | $ | (5,411) | | | $ | 1,481 | | | $ | (3,556) | |
| Cash, cash equivalents and restricted cash at beginning of period | 43,931 | | | 42,450 | | | 46,006 | |
| Cash, cash equivalents and restricted cash at end of period | $ | 38,520 | | | $ | 43,931 | | | $ | 42,450 | |
| Supplemental cash flow information: | | | | | |
| Interest paid | $ | 5,767 | | | $ | 5,700 | | | $ | 8,736 | |
| Income taxes paid | 14,933 | | | 9,788 | | | 9,667 | |
| Income tax refunds received | 2,361 | | | 4,059 | | | 2,070 | |
| Purchases of property, plant and equipment in accounts payable | 324 | | | 84 | | | 2 | |
The accompanying notes are an integral part of these consolidated financial statements.
| | | | | | | | | | | | | | |
| Thermon Group Holdings, Inc. |
| Notes to Consolidated Financial Statements |
| (Dollars in thousands, except share and per share data) |
| March 31, 2023 |
1. Organization and Summary of Significant Accounting Policies
Organization
Thermon Group Holdings, Inc. and its direct and indirect subsidiaries are referred to collectively as "we," "our" or the "Company" herein. We are one of the largest providers of highly engineered industrial process heating solutions for process industries. For over 65 years, we have served a diverse base of thousands of customers around the world in attractive and growing markets, including chemical and petrochemical, oil, gas, power generation, commercial, rail and transit, and other, which we refer to as our "key end markets."
Basis of Consolidation and Presentation
Our consolidated financial statements are prepared in conformity with generally accepted accounting principles in the United States ("GAAP"). The consolidated financial statements include the accounts of the Company, its subsidiaries and entities in which the Company has a controlling financial interest. All intercompany balances have been eliminated in consolidation. Consolidated subsidiaries domiciled in foreign countries comprised approximately 56%, 57% and 65%, of the Company's consolidated sales for fiscal 2023, 2022 and 2021, respectively, and 61% and 62%, of the Company's consolidated total assets at March 31, 2023 and 2022, respectively. In our opinion, the accompanying consolidated financial statements present fairly our financial position at March 31, 2023 and 2022, and the results of operations for the years ended March 31, 2023, 2022, and 2021.
Canadian Emergency Wage Subsidy
On April 11, 2020, the Canadian government officially enacted the Canadian Emergency Wage Subsidy (the “CEWS”) for the purposes of assisting employers in financial hardship due to the COVID-19 pandemic and of reducing potential lay-offs of employees. The CEWS, which was made retroactive to March 15, 2020, generally provided “eligible entities” with a wage subsidy of up to 75% of “eligible remuneration” paid to an eligible employee per week, limited to a certain weekly maximum. On September 23, 2020, the Canadian government announced that the CEWS program would be extended through the summer of 2021 and announced certain modifications to the subsidy calculation. Our Canadian operations have benefited from such wage subsidies and have received distributions from the Canadian government.
During fiscal 2023, 2022, and 2021 we recorded zero, $1,449, and $4,236, respectively, to "Cost of sales" in CEWS subsidies in our consolidated statement of operations and comprehensive income/(loss). Also during fiscal 2023, 2022, and 2021 we recorded zero, $504, and $2,176, respectively, to "Selling, general and administrative expenses" in CEWS subsidies in our consolidated statements of operations and comprehensive income/(loss). As of the end of fiscal 2023, we are no longer receiving CEWS benefits.
Use of Estimates
The preparation of financial statements in conformity with GAAP requires management to make estimates and assumptions that affect the amounts reported in the consolidated financial statements and accompanying notes, including estimates regarding reported amounts of assets and liabilities and disclosures of contingent assets and liabilities at the date of the financial statements and the reported amounts of revenue and expenses during the reporting period. Actual results may differ from those estimates and such differences may be material to the financial statements.
Cash Equivalents
Cash and cash equivalents consist of cash in bank and money market funds. All highly liquid investments purchased with original maturities of three months or less are considered to be cash equivalents.
Restricted Cash
The Company maintains restricted cash related to certain letter of credit guarantees and performance bonds securing performance obligations. The following table provides a reconciliation of cash, cash equivalents, restricted cash included in prepaid expenses and other current assets and restricted cash included in other long-term assets reported within the consolidated balance sheets that sum to the total of the same such amounts shown in the statement of cash flows.
| | | | | | | | | | | | | | | | | |
| March 31,
2023 | | March 31,
2022 | | March 31,
2021 |
| Cash and cash equivalents | $ | 35,635 | | | $ | 41,445 | | | $ | 40,124 | |
| Restricted cash included in prepaid expenses and other current assets | 2,859 | | | 2,486 | | | 1,962 | |
| Restricted cash included in other long-term assets | 26 | | | — | | | 364 | |
| Total cash, cash equivalents, and restricted cash shown in the statement of cash flows | $ | 38,520 | | | $ | 43,931 | | | $ | 42,450 | |
Amounts shown in restricted cash included in prepaid expenses and other current assets and other long-term assets represent those required to be set aside by a contractual agreement, which contain cash deposits pledged as collateral on performance bonds and letters of credit. Amounts shown in restricted cash in other long-term assets represent such agreements that require a commitment term longer than one year.
Accounts Receivable and Concentration of Credit Risk
The Company's receivables are recorded at cost when earned and represent claims against third parties that will be settled in cash. The carrying value of the Company's receivables, net of allowance for doubtful accounts, represents its estimated net realizable value. If events or changes in circumstances indicate specific receivable balances may be impaired, further consideration is given to the Company's ability to collect those balances and the allowance is adjusted accordingly. The Company has established an allowance for doubtful accounts based upon an analysis of aged receivables. Past-due receivable balances are written-off when the Company's internal collection efforts have been unsuccessful in collecting the amounts due.
The Company's primary base of customers operates in the chemical and petrochemical, oil, gas, power generation, rail and transit, and other industries; we are diversifying our customer base through numerous other end markets. Although the Company has a concentration of credit risk within these industries, the Company has not experienced significant collection losses on sales to these customers. The Company's foreign receivables are not concentrated within any one geographic segment nor are they subject to any current economic conditions that would subject the Company to unusual risk. The Company does not generally require collateral or other security from customers. At March 31, 2023 and 2022, no one customer represented more than 10% of the Company's accounts receivable balance. At March 31, 2023, we added $681 to our allowance for doubtful accounts in connection with the Russia Exit. Refer to Note 14, "Restructuring and Other Charges/(Income)" for more information.
At March 31, 2023 and 2022, we had $3,399 and $5,352, respectively, of balances billed but not paid by customers under retention provisions of our contracts. Retention balances typically represent hold backs against project completion.
The Company performs credit evaluations of new customers and sometimes requires deposits, prepayments or use of trade letters of credit to mitigate our credit risk. Allowance for doubtful account balances were $2,682 and $2,177 as of March 31, 2023 and 2022, respectively. Although we have fully provided for these balances, we continue to pursue collection of these receivables.
The following table summarizes the annual changes in our allowance for doubtful accounts:
| | | | | | | | |
| Balance at March 31, 2020 | $ | 834 | |
| Additions to reserve | 1,466 | |
| Write-off of uncollectible accounts | (226) | |
| Balance at March 31, 2021 | 2,074 | |
| Additions to reserve | 683 | |
| Write-off of uncollectible accounts | (580) | |
| Balance at March 31, 2022 | 2,177 | |
| Additions to reserve | 1,377 | |
| Write-off of uncollectible accounts | (872) | |
| Balance at March 31, 2023 | $ | 2,682 | |
Inventories
Inventories, principally raw materials and finished goods, are valued at the lower of cost (weighted average cost) or net realizable value. Our finished goods inventory consists primarily of completed electrical cable that has been manufactured for various heat tracing solutions, as well as various types of immersion, circulation and space heaters for our process heating business. Most of our manufactured product offerings are built to industry standard specifications that have general purpose applications and therefore are sold to a variety of customers in various industries. Some of our products, such as custom orders and ancillary components outsourced from third-party manufacturers, have more specific applications and therefore may be at a higher risk of inventory obsolescence. We determine the inventory valuation reserves based on recent actual usage history. In cases where we are aware of a problem in the valuation of a certain item, a specific reserve is recorded to reduce the item to its estimated net realizable using an estimation of expected sell price less any disposal costs.
Property, Plant and Equipment
Property, plant and equipment are stated at historical cost, less related accumulated depreciation. Expenditures for renewals and improvements that significantly extend the useful life of an asset are capitalized. Expenditures for maintenance and repairs of assets are charged to operations as incurred. When assets are sold or retired, the cost and accumulated depreciation are removed from the accounts and any gain or loss is credited or charged to operations.
Depreciation is computed using the straight-line method over the following useful lives:
| | | | | | | | | | | |
| Years |
| Buildings and improvements | 10 | - | 30 |
| Machinery and equipment | 3 | - | 25 |
| Office furniture and equipment | 3 | - | 10 |
| Internally developed software | 5 | - | 7 |
Long-Lived Assets
The Company evaluates its long-lived assets for impairment whenever events or changes in circumstances indicate that the carrying amount of an asset may not be recoverable. Recoverability of these assets is measured by comparison of the carrying amounts to the future undiscounted cash flows that the assets are expected to generate. If the long-lived assets are considered impaired, the impairment to be recognized equals the amount by which the carrying value of the asset exceeds the estimated fair value and is recorded in the period the determination was made.
In the third quarter of fiscal 2023, we identified a triggering event in our EMEA reportable segment. The depressed economic conditions resulting from the Russo-Ukrainian war as well as the related sanctions were contributing factors in our decision to test our EMEA reportable segment under Accounting Standards Codification ("ASC") Topic 350, Intangibles - Goodwill and Other, and ASC 360, Property, Plant, and Equipment. Based on the results of our quantitative goodwill impairment assessment, there was no impairment of goodwill or intangible assets. We did, however, segregate our Russian subsidiary as a new asset group for long-lived asset impairment testing purposes and determined that the assets relating to our Russian subsidiary were not recoverable under ASC 360. We recorded an impairment charge in fiscal 2023 of $865 to property, plant and equipment, net as well as operating lease right-of-use assets. Refer to Note 14, "Restructuring and Other Charges/(Income)" for more information. No other impairment was recorded during the fourth quarter of fiscal 2023.
The Company determined that no impairment of long-lived assets existed in fiscal 2022 and 2021.
Goodwill and Other Intangible Assets
We conduct a required annual review of goodwill for potential impairment in the fourth quarter, or sooner if events or changes in circumstances indicate that the fair value of a reporting unit is below its carrying value. Our reporting units are our operating segments. We have the option to perform a qualitative assessment to satisfy the annual test requirement if we believe that it is more likely than not that we do not have an impairment in any one of our reporting units. We elected to test our goodwill and other intangible assets using the qualitative method in fiscal 2023, except in our EMEA reportable segment as discussed above. For a full quantitative assessment, if the carrying value of a reporting unit that includes goodwill exceeds its fair value, which is determined using both the income approach and market approach, goodwill is considered impaired. The income approach determines fair value based on discounted cash flow model derived from a reporting unit’s long-term forecasted cash flows. The market approach determines fair value based on the application of earnings multiples of comparable companies to projected earnings of the reporting unit. The amount of impairment loss is measured as the difference between the carrying value and the fair value of a reporting unit but is limited to the total amount of goodwill allocated to the reporting unit. In performing the fair value analysis, management makes various judgments, estimates and assumptions, the most significant of which are the assumptions related to revenue growth rates and discount rates.
We believe that the estimates and assumptions used in our impairment assessment are reasonable; however, these assumptions are judgmental and variations in any assumptions could result in materially different calculations of fair value. We will continue to evaluate goodwill on an annual basis in our fourth quarter, and whenever events or changes in circumstances, such as significant adverse changes in operating results, market conditions, or changes in management’s business strategy indicate that there may be a probable indicator of impairment. It is possible that the assumptions used by management related to the evaluation may change or that actual results may vary significantly from management’s estimates. In fiscal 2023, 2022 and 2021, the Company determined that no impairment of goodwill existed.
Separately, in the first quarter of fiscal 2023, we added $18,620 of goodwill as part of our recent acquisition of Powerblanket, which is discussed further in Note 2, "Acquisition." The newly acquired goodwill is allocated to our US-LAM segment. We believe the goodwill acquired in this recent acquisition represents synergies from combining operations in addition to the identifiable tangible and intangible assets. We anticipate being able to deduct this goodwill for tax purposes.
Other intangible assets include indefinite lived intangible assets for which we must also perform an annual test of impairment. The Company's indefinite lived intangible assets consist primarily of trademarks. If a full quantitative assessment is warranted, the fair value of the Company's trademarks is calculated using a "relief from royalty payments" methodology. This approach involves first estimating reasonable royalty rates for each trademark then applying these royalty rates to a net sales stream and discounting the resulting cash flows to determine the fair value. The royalty rate is estimated using both a market and income approach. The market approach relies on the existence of identifiable transactions in the marketplace involving the licensing of trademarks similar to those owned by the Company. The income approach uses a projected pretax profitability rate relevant to the licensed income stream. We believe the use of multiple valuation techniques results in a more accurate indicator of the fair value of each trademark. This fair value is then compared with the carrying value of each trademark. In fiscal 2023, we performed a qualitative assessment. The results of this test during the fourth quarter of our fiscal year indicated that there was no impairment of our indefinite life intangible assets during fiscal 2023. Additionally, there was no impairment of our indefinite life intangible assets during fiscal 2022 and 2021.
Business Combinations
Accounting for business combinations requires, among other things, the acquiring entity in a business combination to recognize the fair value of the assets acquired and liabilities assumed. We use qualified third-party consultants to assist management in determining the fair value of assets acquired and liabilities assumed. The purchase price allocation process allows us to refine these estimates over a measurement period not to exceed one year to reflect new information obtained surrounding facts and circumstances existing at the acquisition date.
The fair value assigned to identifiable intangible assets acquired is determined primarily by using an income approach, which is based on assumptions and estimates made by management. Significant assumptions utilized in the income approach are the attrition rate, revenue growth rates, earnings before interest, taxes, depreciation and amortization, ("EBITDA") margins, royalty rates, and the discount rate. Some of these assumptions are based on company-specific information and projections, which are not observable in the market and are therefore considered Level 3 measurements. The excess of the purchase price over the fair value of the identified assets and liabilities is recorded as goodwill. Operating results of the acquired entity are reflected within the consolidated financial statements from the date of acquisition.
Revenue Recognition
The core principle of the revenue recognition standard, ASC 606, Revenue from Contracts with Customers ("ASC 606"), is to recognize revenue that reflects the consideration the Company expects to receive for goods or services when or as the promised goods or services are transferred to customers. Management performs the following five steps when applying the revenue recognition standard: (i) identify each contract with customers, (ii) identify each performance obligation in the contracts with customers, (iii) estimate the transaction price (including any variable consideration), (iv) allocate the transaction price to each performance obligation and (v) recognize revenue as each performance obligation is satisfied.
Description of Product and Service Offerings and Revenue Recognition Policies
We provide a (i) suite of products, including heating units, heating cables, tubing bundles, control systems including industry-leading customized software solutions, environmental heating solutions, process heating solutions, temporary heating and lighting, filtration, transportation products, heating blankets, and temporary power products, and (ii) services, including design optimization, engineering, installation and maintenance services required to deliver comprehensive solutions to complex projects. The performance obligations associated with our product sales are generally recognized at a point in time. Where products and services are provided together under a time and materials contract, the performance obligations are satisfied over time. We also provide fixed-fee turnkey solutions consisting of products and services under which the related performance obligations are satisfied over time.
Revenue is recognized when control of the promised goods or services is transferred to our customers in an amount that reflects the consideration we expect to be entitled to receive in exchange for transferring such goods or providing such services. We account for a contract when a customer provides us with a purchase order or other contract that identifies the goods or services to be provided, the payment terms for those services, and when collectability of the consideration due is probable. Generally, our payment terms do not exceed 30 days for product sales, while terms for our fixed-price contracts can vary based on milestones or other key deliverable-based increments. Please refer to Note 5, "Revenue from Contracts with Customers" for additional information.
As mentioned above, we often agree to provide products and services under fixed-price contracts, including our turnkey solutions. These contracts require management to make significant estimates around the total costs to complete the work. Furthermore, under these contracts, we are typically responsible for all cost overruns, other than the amount of any cost overruns resulting from requested changes in order specifications. Our actual costs and any gross profit realized on these fixed-price contracts could vary from the estimated costs on which these contracts were originally based. This may occur for various reasons, including changes in estimates or bidding, changes in availability and cost of labor and raw materials and unforeseen technical and logistical challenges, including with managing our geographically widespread operations and use of third party subcontractors, suppliers and manufacturers in many countries. These variations and the risks inherent in our projects may result in reduced profitability or losses. Refer to Note 5, "Revenue from Contracts with Customers" for further information.
Shipping and Handling Cost
The Company includes shipping and handling as part of cost of sales and freight due from customers is recorded as a component of sales.
Stock-Based Compensation
We account for share-based payments to employees in accordance with ASC Topic 718, Compensation-Stock Compensation ("ASC 718"), which requires that share-based payments (to the extent they are compensatory) be recognized in our consolidated statements of operations and comprehensive income/(loss) based on their fair values.
As required by ASC 718, we recognize stock-based compensation expense for share-based payments that are expected to vest. In determining whether an award is expected to vest, we generally account for forfeitures as they occur, rather than estimate expected forfeitures.
We are also required to determine the fair value of stock-based awards at the grant date. For option awards that are subject to service conditions and/or performance conditions, we estimate the fair values of employee stock options using a Black-Scholes-Merton valuation model. Some of our option grants and awards included a market condition for which we used a Monte Carlo pricing model to establish grant date fair value. These determinations require judgment, including estimating expected volatility. If actual results differ significantly from these estimates, stock-based compensation expense and our results of operations could be impacted. Refer to Note 16, "Stock-Based Compensation Expense" for more information.
Warranties
The Company offers a standard warranty on product sales. Specifically, we will repair or replace any defective product within one year from the date of purchase. Warranties on construction projects are negotiated individually, are typically one year in duration, and may include the cost of labor to repair or replace products. Factors that affect the Company's warranty liability include the amount of sales, historical and anticipated rates of warranty claims, and cost per claim. The Company periodically assesses the adequacy of its recorded warranty liabilities and adjusts the amounts as necessary.
Research and Development
Research and development expenditures are expensed when incurred and are included in selling, general and administrative expenses in our consolidated statements of operations and comprehensive income/(loss). Research and development expenses include salaries, direct material costs incurred, plus building and other overhead expenses. The amounts expensed for fiscal 2023, 2022 and 2021 were $10,568, $6,436 and $7,466, respectively.
Loss Contingencies
We accrue for probable losses from contingencies on an undiscounted basis when such costs are considered probable of being incurred and are reasonably estimable. Legal expense related to such matters are expensed as incurred. We periodically evaluate available information, both internal and external, relative to such contingencies and adjust this accrual as necessary. Disclosure of a contingency is required if there is at least a reasonable possibility that a material loss has been incurred. In determining whether a loss should be accrued, we evaluate, among other factors, the degree of probability of an unfavorable outcome and the ability to make a reasonable estimate of the amount of loss.
Income Taxes
We account for income taxes under the asset and liability method that requires the recognition of deferred tax assets and liabilities for the expected future tax consequences of events that have been recognized in our financial statements or tax returns. Judgment is required in assessing the future tax consequences of events that have been recognized in our financial statements or tax returns. Variations in the actual outcome of these future tax consequences could materially impact our financial position, results of operations or effective tax rate.
Significant judgment is required in determining our worldwide income tax provision. In the ordinary course of a global business, there are many transactions and calculations where the ultimate tax outcome is uncertain. Some of these uncertainties arise as a consequence of revenue sharing and cost reimbursement arrangements among related entities, the process of identifying items of revenue and expense that qualify for preferential tax treatment, and segregation of foreign and domestic earnings and expenses to avoid double taxation. Although we believe that our estimates are reasonable, the final tax outcome of these matters could be different from that which is reflected in our historical income tax provisions and accruals. Such differences could have a material effect on our income tax provision and net income in the period in which such determination is made.
In estimating future tax consequences, all expected future events are considered other than enactments of changes in tax laws or rates. Valuation allowances are established when necessary to reduce deferred tax assets to amounts which are more likely than not to be realized. We consider future growth, forecasted earnings, future taxable income, the mix of earnings in the jurisdictions in which we operate, historical earnings, taxable income in prior years, if carryback is permitted under the law, and prudent and feasible tax planning strategies in determining the need for a valuation allowance. In the event we were to determine that we would not be able to realize all or part of our net deferred tax assets in the future, an adjustment to the deferred tax assets valuation allowance would be charged to earnings in the period in which we make such a determination, or goodwill would be adjusted at our final determination of the valuation allowance related to an acquisition within the measurement period. If we later determine that it is more likely than not that the net deferred tax assets would be realized, we would reverse the applicable portion of the previously provided valuation allowance as an adjustment to earnings at such time. The amount of income tax we pay is subject to ongoing audits by federal, state and foreign tax authorities, which often result in proposed assessments. Our estimate of the potential outcome for any uncertain tax issue is highly judgmental. We account for these uncertain tax issues pursuant to ASC 740, Income Taxes, which contains a two-step approach to recognizing and measuring uncertain tax positions taken or expected to be taken in a tax return. The first step is to determine if the weight of available evidence indicates that it is more likely than not that the tax position will be sustained on audit, including resolution of any related appeals or litigation processes. The second step is to measure the tax benefit as the largest amount that is more than 50% likely to be realized upon ultimate settlement. Although we believe we have adequately reserved for our uncertain tax positions, no assurance can be given with respect to the final outcome of these matters. We adjust reserves for our uncertain tax positions due to changing facts and circumstances, such as the closing of a tax audit, judicial rulings, refinement of estimates or realization of earnings or deductions that differ from our estimates. To the extent that the final outcome of these matters is different than the amounts recorded, such differences generally will impact our provision for income taxes in the period in which such a determination is made. Our provisions for income taxes include the impact of reserve provisions and changes to reserves that are considered appropriate and also include the related interest and penalties.
We expect to repatriate certain foreign earnings from jurisdictions that are subject to withholding taxes. These additional withholding taxes are being recorded as an additional deferred tax liability associated with the basis difference in such jurisdictions.
Foreign Currency Transactions and Translation
Exchange rate gains and losses that result from foreign currency transactions are recognized in income as they are realized. For the Company's non-U.S. dollar functional currency subsidiaries, assets and liabilities of foreign subsidiaries are translated into U.S. dollars using year-end exchange rates. Income and expense items are translated at weighted average exchange rates prevailing during the year. Adjustments resulting from translation of financial statements are reflected as a separate component of shareholders' equity.
Recent Accounting Pronouncements
Reference Rate Reform - In March 2020, the FASB issued Accounting Standards Update 2020-04, Reference Rate Reform ("ASC 848"). The update is intended to provide temporary optional expedients and exceptions to the GAAP guidance on contract modifications and hedge accounting to ease the financial reporting burdens related to the expected market transition from the London Interbank Offered Rate ("LIBOR") and other interbank offered rates to alternative reference rates. We applied the relief from this Accounting Standards Update ("ASU") in fiscal 2023. We adopted this standard effective April 1, 2020, and such adoption did not have a material impact on our consolidated financial statements.
Business Combinations - In October 2021, the FASB issued ASU 2021-08, Accounting for Contract Assets and Contract Liabilities from Contracts with Customers ("ASC 805"). This update requires an acquirer in a business combination to recognize and measure contract assets and contract liabilities (deferred revenue) from acquired contracts using the revenue
recognition guidance in Topic 606. Under this "Topic 606 approach," the acquirer applies the revenue model as if it had originated the contracts. This is a departure from the current requirement to measure contract assets and contract liabilities at fair value. The ASU is effective for all public business entities in annual and interim periods starting after December 15, 2022 and early adoption is permitted. We intend to adopt this standard according to the mandatory adoption requirement, and do not anticipate adoption to have a material impact on our consolidated financial statements.
2. Acquisition
Powerblanket
On May 31, 2022 (the "Acquisition Date"), Thermon Holding Corp., as buyer, acquired 100% of the issued and outstanding equity interests of Flatwork Technologies LLC, GreenHeat IP Holdings, LLC, Heat Authority, LLC, and Warmguard, LLC (collectively, “Powerblanket”) from Glacier Capital LLC, as seller (the "Acquisition"). Powerblanket is a leading North American supplier of heated blankets built upon patented heat spreading technology. The Acquisition increases our exposure to growing industrial and commercial end-markets through its freeze protection, temperature control and flow assurance solutions. We have integrated Powerblanket into our United States and Latin America ("US-LAM") reportable segment. From the period May 31, 2022 to March 31, 2023, Powerblanket contributed $17,144 in Sales and $1,512 in Net income/(loss) to our consolidated operating results.
The initial purchase price for the Acquisition was $35,000, subject to an adjustment for net working capital acquired at closing. Subsequent to the Acquisition Date, and commensurate with the purchase agreement, we increased the purchase price by $299 for net working capital acquired. We financed the Acquisition through the use of our Revolving Credit Facility as well as cash on hand. Because we generally recognize revenue related to Powerblanket at a point-in-time consistent with other products we sell, the acquisition did not result in material contract assets or liabilities.
Acquisition Costs
In accordance with GAAP, costs incurred to complete the Acquisition are expensed as incurred. Total acquisition costs, which represent transaction costs, legal fees, and third-party professional fees were $278, of which $126 were incurred in fiscal 2023. Acquisition costs are reflected in "Selling, general and administrative expenses" in our consolidated statement of operations and comprehensive income/(loss).
Purchase Price Allocation
We have accounted for the Acquisition according to the business combinations guidance found in ASC 805, Business Combinations, henceforth referred to as acquisition accounting. Acquisition accounting requires, among other things, that assets acquired and liabilities assumed be recognized at their fair values as of the acquisition date. We used primarily Level 2 inputs to allocate the purchase price to the major categories of assets and liabilities shown below, with the exception of the contract-based intangible asset, which was valued using Level 3 inputs. For valuing the customer relationships intangible asset, we used a common income-based approach called the multi-period excess earnings method; for the trademarks and developed technology intangible assets, we used a relief-from-royalty method; and for the contract-based intangible asset, we used the with and without method. The carrying values of inventories, property, plant and equipment as well as leased assets approximated their respective fair values at the time of closing.
| | | | | | | | |
| Purchase Price Allocation |
| Amortization Period (years) | Fair Value |
| Accounts receivable | | $ | 1,267 | |
| Inventories | | 3,545 | |
| Property, plant and equipment | | 391 | |
| Other current assets | | 290 | |
| Other non-current assets | | 954 | |
| Intangibles: | | |
| Customer relationships | 9.8 | 3,301 | |
| Trademarks | 9.8 | 3,397 | |
| Contract-based | 5.0 | 1,280 | |
| Developed technology | 15.8 | 5,189 | |
| Goodwill | | 18,620 | |
| Total fair value of assets acquired | | $ | 38,234 | |
| Accounts payable | | (1,098) | |
| Accrued liabilities | | (637) | |
| Other liabilities | | (1,200) | |
| Total fair value of liabilities acquired | | $ | (2,935) | |
| Purchase Price | | $ | 35,299 | |
Unaudited Pro Forma Financial Information
The following unaudited pro forma results of operations assume that the Acquisition occurred at the beginning of the periods presented. These unaudited pro forma results are presented for informational purposes only and are not necessarily indicative of what the actual results of operations would have been if the Acquisition had occurred at the beginning of the periods presented, nor are they indicative of future results of operations. The pro forma results presented below are adjusted for the removal of acquisition and other related costs of $286 which were incurred in our first fiscal quarter ended June 30, 2022.
| | | | | | | | | | | | | | | | | |
| in thousands, unaudited | Twelve Months Ended March 31, 2023 | | Twelve Months Ended March 31, 2022 | | Twelve Months Ended March 31, 2021 |
| Sales | $ | 442,454 | | | $ | 373,676 | | | $ | 290,775 | |
| Net income/(loss) | 33,134 | | | 23,189 | | | 2,287 | |
3. Fair Value Measurements
We measure fair value based on authoritative accounting guidance, which defines fair value, establishes a framework for measuring fair value and expands on required disclosures regarding fair value measurements.
Inputs are referred to as assumptions that market participants would use in pricing the asset or liability. The use of inputs in the valuation process are categorized into a three-level fair value hierarchy.
•Level 1 — uses quoted prices in active markets for identical assets or liabilities we have the ability to access.
•Level 2 — uses observable inputs other than quoted prices in Level 1, such as quoted prices for similar assets and liabilities in active markets; quoted prices for identical or similar assets and liabilities in markets that are not active; or other inputs that are observable or can be corroborated by observable market data.
•Level 3 — uses one or more significant inputs that are unobservable and supported by little or no market activity, and that reflect the use of significant management judgment.
Financial assets and liabilities with carrying amounts approximating fair value include cash, trade accounts receivable, accounts payable, accrued expenses and other current liabilities. The carrying amount of these financial assets and liabilities approximates fair value because of their short maturities. At March 31, 2023 and 2022, no assets or liabilities were valued using Level 3 criteria, except as described in Note 2, "Acquisition."
Information about our financial assets and liabilities measured at fair value are as follows (our outstanding principal amount of the senior secured facility is reported at carrying value):
| | | | | | | | | | | | | | | | | | | | | | | | | | | | | |
| | March 31, 2023 | | March 31, 2022 | | |
| | Carrying
Value | | Fair Value | | Carrying
Value | | Fair Value | | Valuation Technique |
| Financial Assets | | | | | | | | | |
| Deferred compensation plan assets | $ | 6,350 | | | $ | 6,350 | | | $ | 5,391 | | | $ | 5,391 | | | Level 1 - Market Approach |
| Foreign currency contract forwards assets | 60 | | | 60 | | | 105 | | | 105 | | | Level 2 - Market Approach |
| Financial Liabilities | | | | | | | | | |
| Outstanding principal amount of senior secured credit facility | $ | 98,361 | | | $ | 98,115 | | | $ | 129,000 | | | $ | 128,355 | | | Level 2 - Market Approach |
| Deferred compensation plan liabilities | 5,671 | | | 5,671 | | | 4,837 | | | 4,837 | | | Level 1 - Market Approach |
| Foreign currency contract forwards liabilities | 26 | | | 26 | | | — | | | — | | | Level 2 - Market Approach |
| Outstanding borrowings from revolving line of credit | $ | 14,500 | | | $ | 14,500 | | | $ | — | | | $ | — | | | Level 2 - Market Approach |
Long-term Debt
At March 31, 2023 and 2022, the fair value of our long-term debt is based on market quotes available for issuance of debt with similar terms. As the quoted price is only available for similar financial assets, the Company concluded the pricing is indirectly observable through dealers and has been classified as Level 2.
Deferred Compensation Plan Assets
The Company provides a non-qualified deferred compensation plan for certain highly compensated employees where payroll contributions are made by the employees on a pre-tax basis. Please refer to Note 13, "Employee Benefits" for further discussion.
Foreign Currency Forward Contracts
We transact business in various foreign currencies and have established a program that primarily utilizes foreign currency forward contracts to address the risk associated with fluctuations of certain foreign currencies. Under this program, increases or decreases in our foreign currency exposures are offset by gains or losses on the forward contracts to mitigate foreign currency transaction gains or losses. These foreign currency exposures typically arise from intercompany transactions. Our forward contracts generally have terms of 30 days. We do not use forward contracts for trading purposes or designate these forward contracts as hedging instruments pursuant to ASC 815. We adjust the carrying amount of all contracts to their fair value at the end of each reporting period and unrealized gains and losses are included in our results of operations for that period. These gains and losses are intended to offset gains and losses resulting from settlement of payments received from our foreign operations which are settled in U.S. dollars. All outstanding foreign currency forward contracts are marked to market at the end of the period with unrealized gains and losses included in other expense. The fair value is determined by quoted prices from active foreign currency markets (Level 2). The consolidated balance sheets reflect unrealized gains within accounts receivable, net and unrealized losses within accrued liabilities. Our ultimate realized gain or loss with respect to currency fluctuations will depend on the currency exchange rates and other factors in effect as the contracts mature. As of March 31, 2023 and 2022, the notional amounts of forward contracts as well as the related fair values were as follows:
| | | | | | | | | | | |
| March 31, 2023 | | March 31, 2022 |
| | | |
| | | |
| Canadian Dollar | 4,500 | | | 4,000 | |
| South Korean Won | 1,500 | | | 2,250 | |
| | | |
| | | |
| Australian Dollar | — | | | 1,000 | |
| | | |
| Great Britain Pound | 500 | | | — | |
| Chinese Renminbi | 500 | | | — | |
| | | |
| | | |
| Total notional amounts | $ | 7,000 | | | $ | 7,250 | |
Recognized foreign currency gains or losses related to our forward contracts in the accompanying consolidated statements of operations and comprehensive income/(loss) were losses of $(743), $(1,586) and $(811) for fiscal 2023, 2022 and 2021, respectively. Gains and losses from our forward contracts are intended to be offset by transaction gains and losses from the settlement of transactions denominated in foreign currencies. The Company realized net foreign currency gains/(losses) of
$(100), $(1,937), and $283 for fiscal 2023, 2022, and 2021, respectively. Foreign currency gains and losses are recorded within other expense/(income) in our consolidated statements of operations and comprehensive income/(loss).
4. Leases
Description of Leases
The significant majority of our lease obligations are for real property. We lease numerous facilities relating to our operations, primarily for office, manufacturing and warehouse facilities, as well as, from time to time, both long-term and short-term employee housing. Leases for real property have terms ranging from month-to-month to ten years. We also lease various types of equipment, including vehicles, office equipment (such as copiers and postage machines), heavy warehouse equipment (such as fork lifts), heavy construction equipment (such as cranes), medium and light construction equipment used for customer project needs (such as pipe threading machines) and mobile offices and other general equipment that is normally associated with an office environment. Equipment leases generally have terms ranging from six months to five years.
Our lease agreements do not contain any material residual value guarantees or material restrictive covenants. We do not have any significant leases that have not yet commenced but that create significant rights and obligations for us.
We lease temporary power products produced by our Thermon Power Solutions Inc. (“TPS”) division to our customers on a short-term basis. Lease contracts associated with such rental of the temporary power products have historically been month-to-month contracts without purchase options. No lease contracts in which the Company was the lessor have had an initial term in excess of one year.
Variable Lease Payments
A majority of our lease agreements include fixed rental payments. A small number of our lease agreements include fixed rental payments that are adjusted periodically for changes in the Consumer Price Index (“CPI”). Payments based on an index or rate such as CPI are included in the lease payments based on the commencement date index or rate. Estimated changes to the index or rate during the lease term are not considered in the determination of the lease payments.
Options to Extend or Terminate Leases
Most of our real property leases include early termination options and/or one or more options to renew, with renewal terms that can extend the lease term for an additional one to five years or longer. The exercise of lease termination and renewal options is at our sole discretion. If it is reasonably certain that we will exercise such renewal options, the periods covered by such renewal options are included in the lease term and are recognized as part of our Right of Use ("ROU") assets and lease liabilities. Certain leases also include options to purchase the leased property. The depreciable life of assets and leasehold improvements are limited by the expected lease term unless there is a transfer of title or purchase option reasonably certain of exercise.
Discount Rate
The Company's leases generally do not provide an implicit rate, and therefore the Company uses its incremental borrowing rate as the discount rate when measuring operating lease liabilities. The incremental borrowing rate represents an estimate of the interest rate the Company would incur at lease commencement to borrow an amount equal to the lease payments on a collateralized basis over the term of a lease within a particular currency environment. A large concentration of the Company's operating lease liabilities are attributed to our United States and Latin America operations. Our EMEA operations and APAC operations have limited borrowing needs and rely on cash from operations. However, the U.S. operating subsidiary can make intercompany loans if necessary from its available credit capacity given the more preferential rates available to our U.S. operating subsidiary and the ease with which funds can be drawn from the debt facilities already established within the United States. With this in mind, the Company has utilized its U.S. credit facility rate as the worldwide incremental borrowing rate. The Company used incremental borrowing rates as of April 1, 2019 for operating leases that commenced prior to April 1, 2019 to establish the lease liabilities. For operating leases that commenced subsequent to April 1, 2019 and during the fiscal year ended March 31, 2023, rates applicable at or close to the time of the inception of the lease were used to establish the new lease liabilities.
| | | | | | | | | | | |
| Lease Term and Discount Rate | March 31, 2023 | | March 31, 2022 |
| Weighted average remaining lease term | | | |
| Operating | 5.9 | | 5.4 |
| Finance | 1.5 | | 2.5 |
| | | |
| Weighted average discount rate | | | |
| Operating | 4.19 | % | | 4.72 | % |
| Finance | 6.13 | % | | 6.18 | % |
Supplemental balance sheet information related to leases was as follows:
| | | | | | | | | | | | | | | | | | | | | | |
| Assets | | Classification | | March 31, 2023 | | March 31, 2022 | | |
| Operating | | Operating lease right-of-use assets | | $ | 13,570 | | | $ | 10,534 | | | |
| Finance | | Property, plant and equipment | | 131 | | | 351 | | | |
| Total right-of-use assets | | | | $ | 13,701 | | | $ | 10,885 | | | |
| | | | | | | | |
| Liabilities | | | | | | | | |
| Current | | | | | | | | |
| Operating | | Lease liabilities | | $ | 3,258 | | | $ | 3,472 | | | |
| Finance | | Lease liabilities | | 106 | | | 152 | | | |
| Non-current | | | | | | | | |
| Operating | | Non-current lease liabilities | | 12,427 | | | 9,476 | | | |
| Finance | | Non-current lease liabilities | | 52 | | | 183 | | | |
| Total lease liabilities | | | | $ | 15,843 | | | $ | 13,283 | | | |
Supplemental statement of operations information related to leases was as follows:
| | | | | | | | | | | | | | | | | | | | | | | | | | | | |
| Lease expense | | Classification | | | | Year-Ended March 31, 2023 | | Year-Ended March 31, 2022 | | Year-Ended March 31, 2021 |
| Operating lease expense | | Selling, general, and administrative expenses | | | | $ | 4,382 | | | $ | 4,164 | | | $ | 4,697 | |
| | | | | | | | | | |
| Finance lease expense: | | | | | | | | | | |
| Amortization of ROU assets | | Selling, general, and administrative expenses | | | | 134 | | | 166 | | 266 |
| Interest expense on finance lease liabilities | | Interest expense | | | | 15 | | | 27 | | 21 |
| | | | | | | | | | |
| Short-term lease expense | | Selling, general, and administrative expenses | | | | 250 | | | 248 | | | 240 | |
| Net lease expense | | | | | | $ | 4,781 | | | $ | 4,605 | | | $ | 5,224 | |
Supplemental statement of cash flows information related to leases was as follows:
| | | | | | | | | | | | | | | | | | | | |
| Cash paid for amounts included in the measurement of lease liabilities | | Year-Ended March 31, 2023 | | Year-Ended March 31, 2022 | | Year-Ended March 31, 2021 |
| Operating cash used for operating leases | | $ | 4,603 | | | $ | 4,538 | | | $ | 4,566 | |
| Operating cash flows used for finance leases | | 12 | | | 27 | | | 39 | |
| Financing cash flows used for finance leases | | 142 | | | 155 | | | 276 | |
| | | | | | |
Future lease payments under non-cancellable leases as of March 31, 2023 were as follows:
| | | | | | | | | | | | | | |
| Future Lease Payments | | Operating Leases | | Finance Leases |
| Twelve months ending March 31, | | | | |
| 2024 | | $ | 4,115 | | | $ | 123 | |
| 2025 | | 3,448 | | 56 |
| 2026 | | 2,739 | | — | |
| 2027 | | 2,464 | | — | |
| 2028 | | 1,830 | | — | |
| Thereafter | | 3,639 | | — |
| Total lease payments | | $ | 18,235 | | | $ | 179 | |
| Less imputed interest | | (2,550) | | (21) |
| Total lease liability | | $ | 15,685 | | | $ | 158 | |
5. Revenue from Contracts with Customers
Please refer to Note 1, "Organization and Summary of Significant Accounting Policies" for more information regarding our revenue recognition policy.
Performance Obligations
A performance obligation is a promise to provide the customer with a good or service. At contract inception, the Company will assess the goods or services promised in the contract with a customer and shall identify, as a performance obligation, each promise to transfer to the customer either: (i) a good or service (or a bundle of goods or services) or (ii) a series of distinct goods or services that are substantially the same and that have the same pattern of transfer to the customer. For contracts with multiple performance obligations, standalone selling price is generally readily observable.
Revenue from products transferred to customers at a point in time is recognized when obligations under the terms of the contract with the customer are satisfied; generally this occurs with the transfer of control upon shipment. Revenue from products transferred to customers at a point in time accounted for approximately 62.9%, 60.4% and 58.6% of revenue for the fiscal year ended March 31, 2023, 2022, and 2021, respectively
Our revenues that are recognized over time include (i) products and services which are billed on a time and materials basis, and (ii) fixed fee contracts for complex turnkey solutions. Revenue from products and services transferred to customers over time accounted for approximately 37.1%, 39.6% and 41.4% of revenue for the fiscal years ended March 31, 2023, 2022, and 2021, respectively.
For our time and materials service contracts, we recognize revenues as the products and services are provided over the term of the contract and have determined that the stated rate for installation services and products is representative of the stand-alone selling price for those services and products.
Our turnkey projects, or fixed fee projects, offer our customers a comprehensive solution for heat tracing from the initial planning stage through engineering/design, manufacture, installation and final proof-of-performance and acceptance testing. Turnkey services also include project planning, product supply, system integration, commissioning and on-going maintenance. Turnkey solutions, containing multiple deliverables, are customer specific and do not have an alternative use and present an unconditional right to payment, and thus are treated as a single performance obligation with revenues recognized over time as work progresses.
For revenue recognized under fixed fee turnkey contracts, we measure the costs incurred that contribute towards the satisfaction of our performance obligation as a percentage of the total cost of production (the “cost-to-cost method”), and we recognize a proportionate amount of contract revenue, as the cost-to-cost method appropriately depicts performance towards satisfaction of the performance obligation. Changes to the original cost amount may be required during the life of the contract and such estimates are reviewed on a regular basis. Sales and gross profits are adjusted using the cumulative catch-up method for revisions in estimated contract costs. Reviews of estimates have not generally resulted in significant adjustments to our results of operations.
At March 31, 2023, revenues associated with our open performance obligations totaled $163,300, representing our combined backlog and deferred revenue. Within this amount, approximately $11,621 will be earned as revenue in excess of one year. We expect to recognize the remaining revenues associated with unsatisfied or partially satisfied performance obligations within twelve months.
Pricing and Sales Incentives
Pricing is established at or prior to the time of sale with our customers and we record sales at the agreed-upon net selling price. Generally, we do not enter into sales contracts with customers that offer sales discounts or incentives.
Optional Exemptions, Practical Expedients and Policy Elections
We expense the incremental costs of obtaining a contract when incurred because the amortization period would be less than one year.
The Company has elected to treat shipping and handling activities as a cost of fulfillment rather than a separate performance obligation.
The Company has elected to exclude all sales and other similar taxes from the transaction price. Accordingly, the Company presents all collections from customers for sales and other similar taxes on a net basis, rather than having to assess whether the Company is acting as an agent or a principal in each taxing jurisdiction.
Contract Assets and Liabilities
Contract assets and liabilities are presented on our consolidated balance sheet. Contract assets consist of unbilled amounts resulting from sales under long-term contracts when the cost-to-cost method of revenue recognition is utilized and revenue recognized exceeds the amount billed to the customer. In addition, contract assets contain labor and material costs incurred under our time and material service contracts that have not been billed to the customer. Contract liabilities represent deferred revenue from advanced customer payments or billings in excess of costs incurred or revenue earned. The Company invoices customers pursuant to the terms of their related contract. Invoiced amounts are applied to individual contracts and an associated amount is either classified as a contract asset or contract liability depending on whether the revenue associated with the amounts billed had been earned (contract asset) or not (contract liability).
As of March 31, 2023 and 2022, contract assets were $16,272 and $19,626, respectively. There were no impairment losses recognized on our contract assets for the year ended March 31, 2023, 2022, or 2021. As of March 31, 2023 and 2022, contract liabilities were $8,483 and $8,010, respectively. The majority of contract liabilities at March 31, 2022 were recognized in revenue as of March 31, 2023.
Disaggregation of Revenue
We disaggregate our revenue from contracts with customers by geographic location as well as revenue recognized at point in time and revenues recognized over time, as we believe these best depict the nature of our sales and the regions in which those sales are earned and managed.
Revenue recognized at a point-in-time based on when control transitions to the customer and is generally related to our product sales. Moreover, point-in-time revenue does not typically require engineering or installation services. Revenue recognized over time occurs on our projects where engineering or installation services, or a combination of the two, are required. We recognize revenue related to such projects in a systematic way that reflects the transfer of service to the customer.
Disaggregation of revenues from contracts with customers for fiscal 2023, 2022 and 2021 are as follows:
| | | | | | | | | | | | | | | | | | | | | | | | | | |
| | Fiscal Year Ended March 31, 2023 | | |
| | Revenues recognized at point in time | | Revenues recognized over time | | Total | | | | | | |
| United States and Latin America | | $ | 116,924 | | | $ | 92,230 | | | $ | 209,154 | | | | | | | |
| Canada | | 116,112 | | | 37,855 | | | 153,967 | | | | | | | |
| Europe, Middle East and Africa | | 23,483 | | | 19,676 | | | 43,159 | | | | | | | |
| Asia-Pacific | | 20,780 | | | 13,530 | | | 34,310 | | | | | | | |
| Total revenues | | $ | 277,299 | | | $ | 163,291 | | | $ | 440,590 | | | | | | | |
| | | | | | | | | | | | | | | | | | | | |
| | Fiscal Year Ended March 31, 2022 |
| | Revenues recognized at point in time | | Revenues recognized over time | | Total |
| United States and Latin America | | $ | 75,115 | | | $ | 79,072 | | | $ | 154,187 | |
| Canada | | 92,071 | | | 23,371 | | | 115,442 | |
| Europe, Middle East and Africa | | 27,306 | | | 27,431 | | | 54,737 | |
| Asia-Pacific | | 20,317 | | | 10,991 | | | 31,308 | |
| Total revenues | | $ | 214,809 | | | $ | 140,865 | | | $ | 355,674 | |
| | | | | | | | | | | | | | | | | | | | |
| | Fiscal Year Ended March 31, 2021 |
| | Revenues recognized at point in time | | Revenues recognized over time | | Total |
| United States and Latin America | | $ | 47,599 | | | $ | 47,842 | | | $ | 95,441 | |
| Canada | | 67,451 | | | 23,402 | | | 90,853 | |
| Europe, Middle East and Africa | | 29,304 | | | 24,915 | | | 54,219 | |
| Asia-Pacific | | 17,448 | | | 18,220 | | | 35,668 | |
| Total revenues | | $ | 161,802 | | | $ | 114,379 | | | $ | 276,181 | |
6. Net Income/(Loss) per Common Share
Basic net income/(loss) per common share is computed by dividing net income/(loss) by the weighted average number of common shares outstanding during each period. Diluted net income/(loss) per common share is computed by dividing net income/(loss) by the weighted average number of common shares and common share equivalents outstanding (if dilutive) during each period. The number of common share equivalents, which includes options and both restricted and performance stock units, is computed using the treasury stock method. With regard to the performance stock units, we assume that the associated performance targets will be met at the target level of performance for purposes of calculating diluted net income per common share until such time that it is probable that the performance target will not be met.
The reconciliations of the denominators used to calculate basic net income/(loss) per common share and diluted net income/(loss) per common share for fiscal 2023, 2022, and 2021, respectively, is as follows:
| | | | | | | | | | | | | | | | | | | | |
| | Year Ended March 31, 2023 | | Year Ended March 31, 2022 | | Year Ended March 31, 2021 |
| Basic net income/(loss) per common share | | | | | | |
| Net income/(loss) | | $ | 33,666 | | | $ | 20,092 | | | $ | 877 | |
| Weighted-average common shares outstanding | | 33,468,632 | | | 33,308,045 | | | 33,134,592 | |
| Basic net income/(loss) per common share | | $ | 1.01 | | | $ | 0.60 | | | $ | 0.03 | |
| | | | | | | | | | | | | | | | | | | | |
| | Year Ended March 31, 2023 | | Year Ended March 31, 2022 | | Year Ended March 31, 2021 |
| Diluted net income/(loss) per common share | | | | | | |
| Net income/(loss) | | $ | 33,666 | | | $ | 20,092 | | | $ | 877 | |
| Weighted-average common shares outstanding | | 33,468,632 | | | 33,308,045 | | | 33,134,592 | |
| Common share equivalents: | | | | | | |
| Stock options issued | | 7,512 | | | 2,231 | | | 27,306 | |
| Restricted and performance stock units issued | | 269,792 | | | 204,285 | | | 179,056 | |
| Weighted average shares outstanding – dilutive | | 33,745,936 | | | 33,514,561 | | | 33,340,954 | |
| Diluted net income/(loss) per common share | | $ | 1.00 | | | $ | 0.60 | | | $ | 0.03 | |
For the year ended March 31, 2023, 2022, and 2021, 53,911, 110,923 and 85,322 equity awards, respectively, were not included in the calculation of diluted net income/(loss) per common share since they would have had an anti-dilutive effect.
7. Inventories
Inventories consisted of the following:
| | | | | | | | | | | |
| March 31, |
| 2023 | | 2022 |
| Raw materials | $ | 53,845 | | | $ | 41,389 | |
| Work in process | 5,338 | | | 6,294 | |
| Finished goods | 29,511 | | | 25,802 | |
| | 88,694 | | | 73,485 | |
Valuation reserves(1) | (6,562) | | | (1,835) | |
| Inventories, net | $ | 82,132 | | | $ | 71,650 | |
The following table summarizes the annual changes in our valuation reserve accounts:
| | | | | | | | |
| |
| | |
| | |
| Balance as of March 31, 2021 | $ | 1,774 | |
| Additions in reserve | 389 | |
| Charged to reserve | (328) | |
| Balance as of March 31, 2022 | 1,835 | |
| Additions in reserve(1) | 5,535 | |
| Charged to reserve | (808) | |
| Balance as of March 31, 2023 | $ | 6,562 | |
(1) - We increased our valuation reserve in connection with the Russia Exit by $4,325. Refer to Note 14, "Restructuring and Other Charges/(Income)" for more information.
8. Property, Plant and Equipment
Property, plant and equipment consisted of the following:
| | | | | | | | | | | |
| March 31, |
| 2023 | | 2022 |
| Land, buildings and improvements | $ | 55,456 | | | $ | 57,306 | |
| Machinery and equipment | 48,912 | | | 48,365 | |
| Office furniture and equipment | 18,164 | | | 17,014 | |
| Internally developed software | 5,069 | | | 5,851 | |
| Construction in progress | 3,137 | | | 1,457 | |
| Property, plant and equipment at cost | 130,738 | | | 129,993 | |
| Accumulated depreciation | (67,450) | | | (63,954) | |
| Property, plant and equipment, net | $ | 63,288 | | | $ | 66,039 | |
| | | |
Depreciation expense was $9,784, $11,415 and $11,277, in fiscal 2023, 2022, and 2021, respectively.
Included within depreciation expense was amortization of internally developed software of $334, $346, and $766, in fiscal 2023, 2022 and 2021, respectively.
9. Goodwill and Other Intangible Assets
The carrying amount of goodwill for all reporting segments as of March 31, 2023, 2022 and 2021 is as follows:
| | | | | | | | | | | | | | | | | | | | | | | | | | | | | | | | |
| | US-LAM | | Canada | | EMEA | | APAC | | Total |
| Balance as of March 31, 2021 | | $ | 62,725 | | | $ | 121,550 | | | $ | 20,139 | | | $ | 8,624 | | | $ | 213,038 | |
| | | | | | | | | | |
| | | | | | | | | | |
| | | | | | | | | | |
| Foreign currency translation impact | | — | | | 768 | | | (1,052) | | | — | | | (284) | |
| Balance as of March 31, 2022 | | $ | 62,725 | | | $ | 122,318 | | | $ | 19,087 | | | $ | 8,624 | | | $ | 212,754 | |
Goodwill acquired(1) | | 18,620 | | | — | | | — | | | — | | | 18,620 | |
| | | | | | | | | | |
| Foreign currency translation impact | | — | | | (9,373) | | | (408) | | | (1,981) | | | (11,762) | |
| Balance as of March 31, 2023 | | $ | 81,345 | | | $ | 112,945 | | | $ | 18,679 | | | $ | 6,643 | | | $ | 219,612 | |
(1) - Refer to Note 2, "Acquisition" for more information.
Our total intangible assets at March 31, 2023, and 2022 consisted of the following:
| | | | | | | | | | | | | | | | | | | | | | | | | | | | | | | | | | | | | | |
| | Gross Carrying Amount at March 31, 2023 | | Accumulated Amortization | | Net Carrying Amount at March 31, 2023 | | Gross Carrying Amount at March 31, 2022 | | Accumulated Amortization | | Net Carrying Amount at March 31, 2022 |
| Products | | $ | 61,560 | | | $ | (33,344) | | | $ | 28,216 | | | $ | 66,669 | | | $ | (29,445) | | | $ | 37,224 | |
| Trademarks | | 47,427 | | | (2,031) | | | 45,396 | | | 45,222 | | | (1,517) | | | 43,705 | |
| Developed technology | | 14,862 | | | (6,520) | | | 8,342 | | | 9,946 | | | (5,933) | | | 4,013 | |
| Customer relationships | | 113,259 | | | (102,743) | | | 10,516 | | | 113,413 | | | (103,900) | | | 9,513 | |
| Certifications | | 441 | | | — | | | 441 | | | 453 | | | — | | | 453 | |
| Other | | 1,280 | | | (221) | | | 1,059 | | | — | | | — | | | — | |
| Total | | $ | 238,829 | | | $ | (144,859) | | | $ | 93,970 | | | $ | 235,703 | | | $ | (140,795) | | | $ | 94,908 | |
Products intangible assets have an estimated useful life of 10 years. Some trademarks and certifications have indefinite lives and some have useful lives of 8 years to 10 years. Developed technology have estimated useful lives of 16 years to 20 years. Customer relationships intangibles have useful lives of 8 years to 17 years. The other category of intangibles has an estimated useful life of 5 years. The weighted average useful life for the definite-lived intangibles is 13 years.
Intangible assets held in non-U.S. entities are valued in foreign currencies; accordingly, changes in indefinite life intangible assets, such as certifications, at March 31, 2023 and 2022 were the result of foreign currency translation adjustments. Foreign currency translation adjustments also impacted finite life intangible assets held in non-U.S. entities.
The Company recorded amortization expense of $9,447, $8,790, and $9,445 in fiscal 2023, 2022 and 2021, respectively for intangible assets. Annual amortization of intangible assets for the next five fiscal years and thereafter will approximate the following:
| | | | | |
| 2024 | $ | 8,849 | |
| 2025 | 8,524 | |
| 2026 | 8,524 | |
| 2027 | 8,524 | |
| 2028 | 5,746 | |
| Thereafter | 11,152 | |
| Total | $ | 51,319 | |
10. Accrued Liabilities
Accrued current liabilities consisted of the following:
| | | | | | | | | | | |
| | March 31,
2023 | | March 31,
2022 |
| Accrued employee compensation and related expenses | $ | 17,709 | | | $ | 16,235 | |
| Accrued interest | 414 | | | 277 | |
| Customer prepayment | 89 | | | 405 | |
| Warranty reserve | 758 | | | 557 | |
| Professional fees | 2,696 | | | 2,540 | |
| Sales tax payable | 4,301 | | | 2,758 | |
Accrued litigation payable(1) | 5,880 | | | 789 | |
Other(2) | 7,517 | | | 3,410 | |
| Total accrued current liabilities | $ | 39,364 | | | $ | 26,971 | |
(1) - The Company has insurance receivables relating to and materially offsetting the accrued litigation payable recorded in fiscal 2023 and noted above.
(2) - Included in Other are accrued warranty-related costs of $1,996 and $2,523, respectively, associated with the operational execution of a US-LAM project that was completed previously. Additionally, we recorded $3,384 in other for charges on accumulated foreign currency translation losses related to the Russia Exit in fiscal 2023. Refer to Note 14, "Restructuring and Other Charges/(Income).".
11. Short-Term Revolving Credit Facilities
Under the Company’s senior secured revolving credit facility described below in Note 12, “Long-Term Debt,” the Company had $14,500 outstanding borrowings at March 31, 2023, and no outstanding borrowings at March 31, 2022. The short-term classification of the revolving credit facility is based on our intent to repay the borrowings thereunder within the next twelve months.
12. Long-Term Debt
Long-term debt consisted of the following:
| | | | | | | | | | | |
| | March 31,
2023 | | March 31,
2022 |
| Variable Rate Term Loan A due September 2026, net of deferred debt issuance costs of $429 and $640 as of March 31, 2023 and 2022, respectively | $ | 97,932 | | | $ | 128,360 | |
| Less current portion | (10,222) | | | (7,929) | |
| Total | $ | 87,710 | | | $ | 120,431 | |
Senior Secured Credit Facilities
On September 29, 2021, Thermon Group Holdings, Inc. as a credit party and a guarantor, Thermon Holding Corp. (the “US Borrower”) and Thermon Canada Inc. (the “Canadian Borrower” and together with the US Borrower, the “Borrowers”), entered into an Amended and Restated Credit Agreement with several banks and other financial institutions or entities from time to time and JPMorgan Chase Bank, N.A., as Administrative Agent, ("the Agent") which was further amended on November 19, 2021 and March 7, 2023.
The Credit Agreement is an amendment and restatement of that certain Credit Agreement dated October 30, 2017, by and among Borrowers, the lenders party thereto and JPMorgan Chase Bank, N.A. as administrative agent (the “Prior Credit Agreement”), and provides for the following credit facilities described below (collectively, the “Facilities”).
•Revolving Credit Facility: A USD $100,000 five-year secured revolving credit facility made available to the U.S. Borrower. The Revolving Credit Facility includes sub-limits for letters of credit and swing-line loans (the “Revolving Credit Facility”).
•U.S. Term Loan Facility: A USD $80,000 five-year secured term loan A (the “U.S. Term Loan”) made available to the U.S. Borrower (the “U.S. Term Loan Facility”); and
•Canadian Term Loan Facility: A CAD $76,182 five-year term loan A (the “Canadian Term Loan” and, together with the U.S. Term Loan, the “Term Loans”) made available to the Canadian Borrower (the “Canadian Term Loan Facility,” and together with the U.S. Term Loan Facility, the “Term Loan Facilities”).
Proceeds of the Facilities were used at closing to repay and refinance the Borrowers’ existing indebtedness under the Prior Credit Agreement and pay all interest, fees and expenses related thereto, and thereafter are expected to be used for working capital and general corporate purposes.
The Credit Agreement allows for incremental term loans and incremental revolving commitments in an amount not to exceed USD $100,000.
Maturity and Repayment
Each of the Facilities terminates on September 29, 2026. Each of the Term Loans will amortize as set forth in the table below, with payments on the first day of each January, April, July and October, with the balance of each Term Loan Facility due at maturity.
| | | | | | | | |
| Installment Dates | | Original Principal Amount |
| January 1, 2022 through October 1, 2022 | | 1.25 | % |
| January 1, 2023 through October 1, 2024 | | 1.88 | % |
| January 1, 2025 through July 1, 2026 | | 2.50 | % |
Guarantees
The U.S. Term Loan and the obligations of the U.S. Borrower under the Revolving Credit Facility are guaranteed by the Company and all of the U.S. Borrower’s current and future wholly owned domestic material subsidiaries (the “U.S. Subsidiary Guarantors”), subject to certain exceptions. The Canadian Term Loan is guaranteed by the Company, the U.S. Borrower, the U.S. Subsidiary Guarantors and each of the wholly owned Canadian material subsidiaries of the Canadian Borrower, subject to certain exceptions.
Security
The U.S. Term Loan and the obligations of the U.S. Borrower under the Revolving Credit Facility are secured by a first lien on all of the assets of the Company, the U.S. Borrower and the U.S. Subsidiary Guarantors, including 100% of the capital stock of the U.S. Subsidiary Guarantors and 65% of the capital stock of the first tier material foreign subsidiaries of the Company, the U.S. Borrower and the U.S. Subsidiary Guarantors, subject to certain exceptions. The Canadian Term Loan is secured by a first lien on all of the assets of the Company, the U.S. Borrower, the U.S. Subsidiary Guarantors, the Canadian Borrower and the material Canadian subsidiaries of the Canadian Borrower, including 100% of the capital stock of the Canadian Borrower’s material Canadian subsidiaries.
Interest Rates and Fees
The U.S. Borrower will have the option to pay interest on the U.S. Term Loan and borrowings under the Revolving Credit Facility at a base rate, plus an applicable margin, or at a rate based on the Secured Overnight Financing Rate, or "SOFR," plus an applicable margin. The Canadian Borrower will have the option to pay interest on the Canadian Term Loan at a prime rate, plus an applicable margin, or at a rate based on the Canadian Dollar Offered Rate, or "CDOR," plus an applicable margin.
Under the applicable Facilities, the margin for base rate loans and Canadian prime rate loans is 62.5 basis points and the applicable margin for SOFR loans and CDOR loans is 162.5 basis points; provided that, following the completion of one full fiscal quarter after the closing date, the applicable margins will be determined based on a leverage-based performance grid.
In addition to paying interest on outstanding principal under the Revolving Credit Facility, the U.S. Borrower is required to pay a commitment fee in respect of unutilized revolving commitments of 0.25% per annum, provided that,
following the completion of one full fiscal quarter after the closing date, the commitment fee will be determined based on a leverage-based performance grid.
Voluntary Prepayment
The Borrowers will be able to voluntarily prepay the principal of the loans outstanding under each of the Facilities without penalty or premium (subject to breakage fees) at any time in whole or in part.
Mandatory Prepayment
Each Borrower is required to repay its respective Term Loan with certain asset sale and insurance proceeds and certain debt proceeds.
Debt Issuance Costs
The Company capitalizes and defers the costs associated with establishing our debt and financing arrangements. These costs are amortized as interest expense over the life of the loan or related financing. Additionally, for any unscheduled principal payments the Company will record incremental deferred debt charges on a pro rata basis of the unamortized deferred debt balance at the time of the repayment. When debt or the contract is retired prematurely, the proportionate unamortized deferred issuance costs are expensed as loss on retirement. Deferred debt issuance costs expensed as part of interest expense for fiscal 2023, 2022 and 2021 were $317, $596 and $1,525, respectively.
We incurred fees to third parties in connection with our entry into the Credit Agreement described above. The debt issuance costs of $1,265 were capitalized and will be amortized over the life of the Credit Agreement in fiscal 2022. Additionally, we recognized a loss on debt extinguishment of $2,569 in fiscal 2022, which was recorded to Other income/(expense) on our consolidated statements of operations and comprehensive income/(loss).
Financial Covenants
In connection with the Credit Agreement, the Company is required, on a consolidated basis, to maintain certain financial covenant ratios. On the last day of any period of four fiscal quarters ending during a period set forth below, the Company must maintain a consolidated leverage ratio that does not exceed the ratios for such period set forth below (each of which ratios may be increased by 0.50:1.00 for each of the four fiscal quarters following certain acquisitions at the election of the U.S. Borrower):
| | | | | | | | |
| Fiscal Quarter Ending | | Consolidated Leverage Ratio |
| September 30, 2021 through September 30, 2022 | | 3.75:1.00 |
| December 31, 2022 and each fiscal quarter thereafter | | 3.50:1.00 |
In addition, on the last day of any period of four fiscal quarters ending on or after September 30, 2021, the Company must maintain a consolidated fixed charge coverage ratio of not less than 1.25:1.00. As of March 31, 2023, we were in compliance with all financial covenants of the Credit Agreement and there is no material uncertainty about our ongoing ability to comply with our covenants.
Other Covenants
The Credit Agreement contains restrictive covenants (in each case, subject to certain exclusions) that limit, among other things, the ability of the Company and its subsidiaries (including the Borrowers) to:
•incur additional indebtedness;
•grant liens;
•make certain fundamental changes;
•sell assets;
•make restricted payments;
•enter into sales and leasebacks;
•make investments;
•prepay certain indebtedness;
•enter into transactions with affiliates; and
•enter into certain restrictive agreements.
The covenants are subject to various baskets and materiality thresholds, with certain of the baskets to the restrictions on the repayment of subordinated or unsecured indebtedness, restricted payments and investments being available only when the Company’s pro forma leverage ratios are less than a certain level.
The Credit Agreement contains certain customary representations and warranties, affirmative covenants and events of default, including, among other things, payment defaults, breach of representations and warranties, covenant defaults, cross-defaults to certain indebtedness, certain events of bankruptcy, certain events under ERISA, judgment defaults, actual or asserted failure of any guaranty or security documents to be in full force and effect and change of control. If such an event of default occurs, the Agent will be entitled to take various actions, including the termination of the commitment for the Revolving Credit Facility, the acceleration of amounts due under the Credit Agreement and certain other actions that a secured creditor is customarily permitted to take following a default.
At March 31, 2023, we had $83,653 of available borrowing capacity thereunder after taking into account the borrowing base and $16,347 of outstanding letters of credit. The Term Loans bear interest at the SOFR rate or CDOR rate, as applicable, in each case plus an applicable margin dictated by our leverage ratio (as described above). The interest rates on the Term Loan Facilities on March 31, 2023 were 6.27% for the Canadian Term Loan Facility, 5.59% for the U.S. Term Loan Facility, and 6.16% for the U.S. revolving credit facility. Interest expense has been presented net of interest income on our consolidated statements of operations and comprehensive income/(loss).
Maturities of long-term debt principal payments are as follows for the fiscal years ended March 31:
| | | | | | | | |
| 2024 | | $ | 10,222 | |
| 2025 | | 11,074 | |
| 2026 | | 13,629 | |
| 2027 | | 63,436 | |
| 2028 | | — | |
| Total | | $ | 98,361 | |
13. Employee Benefits
The Company has defined contribution plans covering substantially all domestic employees and certain foreign subsidiary employees who meet predefined service and eligibility requirements. Participant benefits are 100% vested upon participation. The Company matches employee contributions, limited to 50% of the first 10% of each eligible employee's salary contributed. The Company's matching contributions to defined contribution plans on a consolidated basis were approximately $3,180, $2,708, and $2,561 in fiscal 2023, 2022, and 2021, respectively.
The Company has an incentive compensation program to provide employees with incentive pay based on the Company's ability to achieve certain sales, profitability, and safety objectives. From time to time, the compensation committee of the Board of Directors, at its sole discretion, can add additional amounts to the overall incentive pay achieved. The Company recorded approximately $9,668, $7,258, and $2,767 for incentive compensation earned and other discretionary amounts in fiscal 2023, 2022, and 2021, respectively.
The Company provides a non-qualified deferred compensation plan for certain highly compensated employees where payroll contributions are made by the employees on a pre-tax basis. Included in “Other long-term assets” in the consolidated balance sheets at March 31, 2023 and 2022 were $6,350 and $5,391, respectively, of deferred compensation plan assets held by the Company. Deferred compensation plan assets (mutual funds) are measured at fair value on a recurring basis based on quoted market prices in active markets (Level 1). The Company has a corresponding liability to participants of $5,671 and $4,837 included in “Other long-term liabilities” in the consolidated balance sheet at March 31, 2023 and 2022, respectively. Deferred compensation plan expense/(income) was $(208), $283, and $1,564 for the years ended March 31, 2023, 2022, and 2021 respectively, and is presented as such in our consolidated statements of operations and comprehensive income/(loss). Expenses and income from our deferred compensation plan were mostly offset by unrealized gains and losses for the deferred compensation plan included in other income/(expense) on our consolidated statements of operations and comprehensive income/(loss). Our unrealized (gains)/losses on investments were $154, $(285), and $(1,635) for the year ended March 31, 2023, 2022, and 2021, respectively.
14. Restructuring and Other Charges/(Income)
As a result of the continued impact of the Russo-Ukrainian war, including the sanctions related thereto, in the third quarter of fiscal 2023, we identified a triggering event in our EMEA reportable segment. Given the continuing depressed economic conditions resulting from the Russo-Ukrainian war, including sanctions related thereto, the Company commenced a strategic assessment of its operations in its Russian subsidiary and we concluded that there was uncertainty in whether the Company could realize significant future economic benefits. Therefore, we recorded a total charge of $8,334 in the third fiscal quarter of 2023.
In the fourth quarter of fiscal 2023, on January 31, 2023, our board of directors authorized the Company to withdraw from its operations in the Russian Federation (the “Russia Exit”), through a planned disposition of its Russian subsidiary. We
expect to complete the Russia Exit by the second quarter of fiscal 2024, subject to the receipt of the requisite regulatory approvals. The carrying value of the remaining assets and liabilities is zero.
Additionally, in the fourth fiscal quarter, we moved the Russian subsidiary and its related assets and liabilities into an Assets Held-for-Sale asset group. Therefore, according to ASC 205, Presentation of Financial Statements, we marked down the asset group to its fair value less cost to sell. In fiscal 2023, we recorded the following charges:
| | | | | | | | | | | | | | |
| Charge | | Financial statement impact | | Amount |
| Cash and cash equivalents | | Cash and cash equivalents; Selling, general and administrative expenses | | $ | 3,939 | |
| Increase in Current Expected Credit Loss, or "CECL," allowance for credit loss | | Accounts receivable, net; Selling, general and administrative expenses | | 681 | |
| Increase in inventory valuation reserves | | Inventories, net; Cost of sales | | 4,325 | |
| Contract assets | | Contract assets; Restructuring and other charges/(income) | | 347 | |
| Prepaid expenses and other current assets | | Prepaid expenses and other current assets, Income tax receivable; Restructuring and other charges/(income) | | 1,102 | |
| Property, plant and equipment, net | | Property, plant and equipment, net; Restructuring and other charges/(income) | | 298 | |
| Operating lease right-of-use assets | | Operating lease right-of-use assets; Restructuring and other charges/(income) | | 567 | |
| Other non-current assets | | Deferred income taxes, Other non-current assets; Restructuring and other charges/(income) | | 83 | |
| Current and non-current liabilities, net, including accumulated foreign currency translation losses | | Current liabilities; Restructuring and other charges/(income) | | 1,296 | |
| | | | | $ | 12,638 | |
All charges described above were recorded in our EMEA reportable segment, with the exception of $241 of cost of sales from an increase in inventory reserves in our Canada reportable segment. Additionally, we incurred $282 in certain legal and professional fees related to the Russia Exit, of which $209 were recognized in the fourth fiscal quarter of 2023.
During fiscal 2022, we recorded $(103) for severance-related activity in our Canadian segment which was recorded to "Restructuring and other charges/(income)" in our consolidated statements of operations and comprehensive income/(loss). Additionally, we recorded $(311) in cash receipts related to receivables existing prior to the sale of our South Africa business, which was completed in fiscal 2021.
During fiscal 2021, we enacted certain restructuring initiatives to align our cost structure with the decline in demand for our products and services primarily due to COVID-19 and supply/demand fluctuations in commodity prices. Moreover, during fiscal 2021, the Company terminated approximately 252 people (both hourly and salaried positions) and incurred $5,748 in one-time severance costs. These charges were recorded to restructuring and other charges/(income) in our consolidated statements of operations and comprehensive income/(loss).
In addition, we incurred $429 in lease impairment costs primarily related to one of our Canadian facilities that was substantially vacated by December 31, 2020, as the Company executed efforts to optimize its global manufacturing footprint. We also exercised the early termination option for one of our existing leases in Canada, which resulted in the remeasurement of the related right-of-use asset and lease liability and accelerated the lease amortization and expense to align with the cease use date of the facility. We substantially vacated the facility by December 31, 2020. Finally, we early terminated one of our leases in our US-LAM segment. As a result of these abandonments, we recorded a total of $381 in lease abandonment charges during fiscal 2021. We recorded these charges to restructuring and other charges/(income) in our consolidated statements of operations and comprehensive income/(loss).
Disposal of South Africa Business
On December 15, 2020, a Sale of Shares Agreement was entered into between one of our consolidated subsidiaries and an investor consortium (the "TSAPL Purchasers"). As a result of this agreement, 100% of the outstanding common shares of our consolidated subsidiary, Thermon South Africa Proprietary Limited (the "South Africa Business"), were sold to the TSAPL Purchasers, with aggregate proceeds of 2,500 South African Rand (ZAR), or $167, as partial satisfaction of an existing note receivable. In addition, Purchasers committed to settle operational receivables attributable to other Company subsidiaries existing at the time of sale.
After evaluating our presence in the region served by the South Africa Business, the Company decided to centralize and consolidate our business structure and streamline our organization. A member of the TSAPL Purchasers was the current general manager of the operations of the South Africa business at the time of sale. This sale is accompanied by a distribution agreement whereby the new owners of the business have agreed to distribute our products, continuing the Company's presence in the region. We believe this is an opportunity to optimize the business while pivoting to a new relationship that will better enable us to serve our customers.
As a result of the sale and in accordance with ASC Topic 360, Impairment and Disposal of Long-Lived Assets ("ASC 360"), we recognized a loss on the sale of a business of $2,065 in fiscal 2021, which included the impact of a currency translation adjustment of $828. This loss was recognized within restructuring and other charges/(income) on the consolidated statements of operations and comprehensive income/(loss). The reported loss on sale of stock is not deductible for tax. Prior to the disposal, the South Africa Business's results were reported within the "Europe, Middle East and Africa" segment.
Restructuring and other charges/(income) by reportable segment were as follows:
| | | | | | | | | | | | | | | | | |
| Year Ended March 31, 2023 | | Year Ended March 31, 2022 | | Year Ended March 31, 2021 |
| United States and Latin America | $ | — | | | $ | (46) | | | $ | 3,563 | |
| Canada | — | | | (186) | | | 2,591 | |
| Europe, Middle East and Africa | 3,693 | | | (182) | | | 2,459 | |
| Asia-Pacific | — | | | — | | | 10 | |
| | $ | 3,693 | | | $ | (414) | | | $ | 8,623 | |
Restructuring activity related to severance activity described above recorded in "Accrued liabilities" on the consolidated balance sheets is summarized as follows:
| | | | | | | | |
| Beginning balance, April 1, 2021 | | $ | 657 | |
| Costs incurred | | (103) | |
| Less cash payments | | (554) | |
| Beginning balance, April 1, 2022 | | $ | — | |
| Costs incurred | | — | |
| Less cash payments | | — | |
| Ending balance, March 31, 2023 | | $ | — | |
15. Commitments and Contingencies
Letters of Credit, Bank Guarantees, and Other Commitments
At March 31, 2023, and 2022, the Company had in place letter of credit guarantees and performance bonds securing performance obligations of the Company. These arrangements totaled approximately $30,753 and $9,760 as of March 31, 2023, and 2022, respectively. Of this amount, $1,211 and $953 is secured by cash deposits at the Company's financial institutions at March 31, 2023, and 2022, respectively, and an additional $1,847 and $2,948, respectively, represents a reduction of the available amount of the Company's short term and long-term revolving lines of credit. Included in prepaid expenses and other current assets at March 31, 2023 and 2022, was approximately $2,859 and $2,486, respectively, of cash deposits pledged as collateral on performance bonds and letters of credit. In addition to the $30,753 and $9,760 above, our Indian subsidiary also has $4,418 and $4,807 in non-collateralized customs bonds outstanding at March 31, 2023 and 2022, respectively, to secure the Company's customs and duties obligations in India.
The Company has entered into information technology service agreements with several vendors. The service fees expense amounted to $1,332, $2,498, and $1,768 in fiscal 2023, 2022, 2021, respectively. The future annual service fees under the service agreements are as follows for the fiscal years ended March 31:
| | | | | |
| 2024 | $ | 1,514 | |
| 2025 | 49 | |
| 2026 | — | |
| |
| |
| |
| Total | $ | 1,563 | |
As of March 31, 2023, the Company has accrued $1,996 as estimated additional cost related to the operational execution of a project in our US-LAM segment. Refer to Note 10, "Accrued Liabilities" for more information.
Changes in the Company's warranty reserve are as follows:
| | | | | | |
| Balance at March 31, 2020 | | $ | 477 | |
| Reserve for warranties issued during the period | | 217 | |
| Settlements made during the period | | (444) | |
| Balance at March 31, 2021 | | $ | 250 | |
| Reserve for warranties issued during the period | | 605 | |
| Settlements made during the period | | (298) | |
| Balance at March 31, 2022 | | $ | 557 | |
| Reserve for warranties issued during the period | | 607 | |
| Settlements made during the period | | (406) | |
| Balance at March 31, 2023 | | $ | 758 | |
Legal Proceedings
We are involved in various legal and administrative proceedings that arise from time to time in the ordinary course of doing business. Some of these proceedings may result in fines, penalties or judgments being assessed against us, which may adversely affect our financial results. In addition, from time to time, we are involved in various disputes, which may or may not be settled prior to legal proceedings being instituted and which may result in losses in excess of accrued liabilities, if any, relating to such unresolved disputes. As of March 31, 2023, management believes that adequate reserves have been established for any probable and reasonably estimable losses. Expenses related to litigation reduce operating income. We do not believe that the outcome of any of these proceedings or disputes would have a significant adverse effect on our financial position, long-term results of operations, or cash flows. It is possible, however, that charges related to these matters could be significant to our results of operations or cash flows in any one reporting period.
In January 2020, the Company received service of process in a class action application in the Superior Court of Quebec, Montreal, Canada related to certain heating elements previously manufactured by THS and incorporated into certain portable construction heaters sold by certain manufacturers. The Company believes this claim is without merit and intends to vigorously defend itself against the claim. While the Company continues to dispute the allegations, in March 2021, it reached an agreement in principle with the plaintiff and other defendants to resolve this matter without admitting to any liability; such agreement remains subject to the agreement of the parties on the terms of a definitive settlement agreement. Settlement of this matter on the agreed terms will require the Company to contribute an amount that would not have a material impact on the Company’s consolidated financial position, results of operations or cash flows. The settlement is subject to, among other things, approval by the Superior Court.
16. Stock-Based Compensation Expense
The Board of Directors has adopted and the shareholders have approved three stock option award plans. The 2010 Thermon Group Holdings, Inc. Restricted Stock and Stock Option Plans ("2010 Plan") was approved on July 28, 2010. The plan authorized the issuance of 2,767,171 stock options or restricted shares (on a post stock split basis). On April 8, 2011, the Board of Directors approved the Thermon Group Holdings, Inc. 2011 Long-Term Incentive Plan ("2011 LTIP"). The 2011 LTIP made available 2,893,341 shares of the Company's common stock that may be awarded to employees, directors or non-employee contractor's compensation in the form of stock options or restricted stock awards. On May 21, 2020, the Board of Directors approved the Thermon Group Holdings, Inc. 2020 Long-Term Incentive Plan ("2020 LTIP"). The 2020 LTIP made available 1,400,000 shares of the Company's common stock that may be awarded to employees, directors, or non-employee contractor's compensation in the form of stock options or restricted stock awards. Collectively, the 2010 Plan, the 2011 LTIP, and the 2020 LTIP are referred to as the "Stock Plans." The Company does not hold any shares of its own stock as treasury shares. Accordingly, the vesting of restricted stock units and performance stock units and the exercise of stock options result in the issuance of additional new shares of the Company's stock. For fiscal 2023, 2022, and 2021, we recorded stock-based compensation of $5,954, $3,803, and $3,728, respectively.
Unvested options outstanding are scheduled to cliff vest over three years with 100% vesting on the third anniversary date of the grant. Stock options must be exercised within 10 years from date of grant. Stock options were issued with an exercise price which was equal to the market price of our common stock at the grant date. We account for forfeitures as they occur, rather than estimate expected forfeitures.
Stock Options
A summary of stock option activity under our Stock Plans for fiscal 2023, 2022, and 2021 are as follows:
| | | | | | | | | | | | | | | | | |
| | | Options Outstanding |
| | | Number of Shares | | Weighted Average Exercise Price |
| Balance at March 31, 2020 | | 163,016 | | $ | 12.25 | |
| Granted | | 71,780 | | 14.28 | |
| Exercised | | (97,156) | | 6.81 | |
| Forfeited | | (16,171) | | 14.28 | |
| Expired | | (10,068) | | $ | 14.73 | |
| Balance at March 31, 2021 | | 111,401 | | $ | 16.53 | |
| Granted | | — | | — | |
| Exercised | | (8,100) | | 12.00 | |
| Forfeited | | (9,742) | | 14.28 | |
| Expired | | (4,322) | | 16.30 | |
| Balance at March 31, 2022 | | 89,237 | | $ | 17.20 | |
| Expired | | (14,871) | | $ | 21.52 | |
| Balance at March 31, 2023 | | 74,366 | | $ | 16.33 | |
For fiscal 2023, 2022, and 2021, the intrinsic value of stock option exercises was $0, $60, and $646, respectively. As of March 31, 2023, there was no unrecognized expense related to unvested stock option awards.
The following table summarizes information about stock options outstanding as of March 31, 2023:
| | | | | | | | | | | | | | | | | | | | | | | | | | | | | | | | | | | | | | | | | | | | | | | | | | |
| | Options Outstanding | | Options Vested and Exercisable |
| Exercise Price | | Number Outstanding | | Weighted Average Contractual Life (Years) | | Weighted Average Exercise Price | | Aggregate Intrinsic Value at March 31, 2023 | | Number Vested and Exercisable | | Weighted Average Contractual Life (Years) | | Weighted Average Exercise Price | | Aggregate Intrinsic Value at March 31, 2023 |
| $14.28 | | 45,867 | | 7.2 | | $ | 14.28 | | | $ | 393,810 | | | — | | | 7.2 | | $ | — | | | $ | — | |
| $19.64 | | 28,499 | | 3.8 | | 19.64 | | | 244,690 | | | 28,499 | | | 3.8 | | 19.64 | | | — | |
| $14.28 - $19.64 | | 74,366 | | | 5.9 | | $ | 16.33 | | | $ | 638,500 | | | 28,499 | | | 5.9 | | $ | 19.64 | | | $ | — | |
The aggregate intrinsic value in the preceding table represents the total intrinsic value based on our closing stock price of $24.92 as of March 31, 2023, which would have been received by the option holders had all option holders exercised as of that date.
Stock options are valued by using a Black-Scholes-Merton option pricing model. We calculate the value of our stock option awards when they are granted. Accordingly, we update our valuation assumptions for volatility and the risk-free interest rate each quarter that option grants are awarded. Annually, we prepare an analysis of the historical activity within our option plans as well as the demographic characteristics of the grantees of options within our stock option plan to determine the estimated life of the grants and possible ranges of estimated forfeiture. The expected life was determined using the simplified method for estimating expected option life, which qualify as "plain-vanilla" options. The risk-free interest rate is based on the rate of a zero-coupon U.S. Treasury instrument with a remaining term approximately equal to the expected term. We do not expect to pay dividends in the near term and therefore do not incorporate the dividend yield as part of our assumptions.
Restricted Stock Awards and Units
Restricted stock awards have been issued to members of our board of directors and restricted stock units have been issued to certain employees. For restricted stock awards, the actual common shares have been issued with voting rights and are included as part of our total common shares outstanding. The common shares may not be sold or exchanged until the vesting period is completed. For restricted stock units, no common shares are issued until the vesting period is completed. For restricted stock units, the Company allows its employees to withhold a portion of their units upon the vesting dates in order to satisfy their tax obligation. For both restricted stock awards and units, fair value is determined by the market value of our common stock on the date of the grant.
We established a plan to issue our directors awards of fully vested common stock in lieu of restricted stock awards. During fiscal 2023, 2022, and 2021 we issued 38,137, 32,136 and 52,098 fully vested common shares which had a total fair value of $624, $570, and $712 based on the closing price of our common stock on the date of issuance, respectively. As of March 31, 2023, there were no outstanding restricted stock awards.
The following table summarizes the activity with regard to unvested restricted stock units issued to employees during fiscal 2023, 2022, and 2021.
| | | | | | | | | | | | | | | | | |
| Restricted Stock Units | | Number of Shares | | Weighted Average Grant Fair Value |
| Balance of unvested units at March 31, 2020 | | 236,706 | | $ | 22.14 | |
| Granted | | 222,679 | | 13.75 | |
| Released | | (115,504) | | | 21.33 | |
| Forfeited | | (39,357) | | | 16.95 | |
| Balance of unvested units at March 31, 2021 | | 304,524 | | | $ | 12.96 | |
| Granted | | 139,242 | | | 17.62 | |
| Released | | (125,089) | | | 19.42 | |
| Forfeited | | (24,524) | | | 14.81 | |
| Balance of unvested units at March 31, 2022 | | 294,153 | | $ | 16.26 | |
| Granted | | 167,842 | | 16.82 | |
| Released | | (112,157) | | 17.56 | |
| Forfeited | | (13,584) | | 15.83 | |
| Balance of unvested units at March 31, 2023 | | 336,254 | | $ | 16.12 | |
Based on our closing stock price of $24.92, the aggregate intrinsic value of the unvested restricted stock units at March 31, 2023 was $8,373. Total unrecognized expense related to unvested restricted stock units was approximately $3,272 as of March 31, 2023. We anticipate this expense to be recognized over a weighted average period of approximately 1.0 years.
Performance Stock Units
During fiscal 2023, 2022, and 2021, performance stock unit awards were issued to our executive officers and other members of management and had total estimated grant date fair values of $2,547, $1,689 and $1,947, respectively. For the fiscal 2023 awards, the performance indicator for these awards is a combination of stock price and the Company's Adjusted EBITDA. The target number of shares is 62,530 and 72,949 for the stock price awards and Adjusted EBITDA awards, respectively. For those awards utilizing a stock price indicator, the stock price indicator measures our stock price relative to a predetermined peer group of companies with similar business characteristics as ours. Since the stock price indicator is market-based, we prepared a Monte Carlo valuation model to calculate the probable outcome of the market for our stock to arrive at the fair value. The fair value of the market-based units will be expensed over three years, whether or not the market condition is met. For those awards utilizing an Adjusted EBITDA indicator, the Adjusted EBITDA indicator establishes the target Adjusted EBITDA for each of the next three years from the grant date. Since these are performance-based stock awards, the Company will make estimates of periodic expense until the Adjusted EBITDA target is known and the expense for actual number of shares earned is determinable.
During fiscal 2023, certain Adjusted EBITDA-based performance awards paid at 200% of their target based on the Company's performance during the fiscal year.
During fiscal 2022 and 2021, certain Adjusted EBITDA-based performance stock awards that were scheduled to vest did not meet the minimum Adjusted EBITDA indicator. Accordingly, 67,220 and 130,835 of previously outstanding performance stock units were forfeited during fiscal 2022 and 2021, respectively.
For performance stock units, the performance period will end on the third fiscal year end subsequent to the award being granted. It will then be determined how many shares of stock will be issued. In each year of the performance period, the possible number of shares will range from zero percent to two hundred percent of the target shares.
The following table summarized the target number of performance stock units outstanding and the minimum and maximum number of shares that can be earned as of March 31, 2023.
| | | | | | | | | | | | | | | | | |
| Fiscal Year Granted | Target | | Minimum | | Maximum |
| Fiscal 2021 | 136,350 | | — | | 272,700 |
| Fiscal 2022 | 95,068 | | — | | 190,136 |
| Fiscal 2023 | 135,479 | | — | | 270,958 |
In fiscal 2023, 2022 and 2021, the performance objectives for 182,423, 91,164 and 4,476 awards, respectively, were earned.
At March 31, 2023, there was $5,648 in stock compensation that remained to be expensed, which will be recognized over a period of 1.0 years.
17. Other Income/(Expense)
Other expense consisted of the following:
| | | | | | | | | | | | | | | | | |
| Year-Ended March 31, 2023 | | Year-Ended March 31, 2022 | | Year-Ended March 31, 2021 |
| Foreign currency transaction gain/(loss) | $ | 643 | | | $ | (2,377) | | | $ | 1,094 | |
| Gain/(loss) on foreign exchange forwards | (743) | | | 441 | | | (811) | |
| Gain/(loss) on investments from deferred compensation plan | (154) | | | 285 | | | 1,635 | |
| Loss on debt extinguishment | — | | | (2,569) | | | — | |
| Other income/(expense) | 168 | | | 55 | | | 217 | |
| Total | $ | (86) | | | $ | (4,165) | | | $ | 2,135 | |
18. Income Taxes
Income taxes included in the consolidated income statement consisted of the following:
| | | | | | | | | | | | | | | | | | | | |
| | Year Ended March 31, 2023 | | Year Ended March 31, 2022 | | Year Ended March 31, 2021 |
| Current provision: | | | | | |
| Federal provision | $ | 6,329 | | | $ | 634 | | | $ | (4,662) | |
| Foreign provision | 12,619 | | | 8,907 | | | 6,098 | |
| State provision | 1,181 | | | 441 | | | 197 | |
| Deferred provision: | | | | | |
| Federal deferred benefit | (2,648) | | | (231) | | | (1,963) | |
| Foreign deferred benefit | (1,649) | | | (1,396) | | | (1,084) | |
| State deferred benefit | (265) | | | (22) | | | (107) | |
| Total provision for income taxes | $ | 15,567 | | | $ | 8,333 | | | $ | (1,521) | |
Deferred income tax assets and liabilities were as follows:
| | | | | | | | | | | | | | | | | |
| | | March 31, |
| | | 2023 | | 2022 |
| Deferred tax assets: | | | | |
| Accrued liabilities and reserves | | $ | 6,868 | | | $ | 5,483 | |
| Capitalized research and development costs | | 1,747 | | | — | |
| Foreign deferred benefits | | 1,250 | | | 1,626 | |
| Stock option compensation | | 802 | | | 736 | |
| Net operating loss carryforward | | 453 | | | 801 | |
| Inventories | | 584 | | | 415 | |
| Interest limitation | | — | | | 94 | |
| Capitalized transaction costs | | 124 | | | 95 | |
| Tax credit carryforward | | 225 | | | 214 | |
| Unrealized gain on hedge | | 8 | | | — | |
| Valuation allowance | | (238) | | | (248) | |
| | | | | |
| Total deferred tax assets | | $ | 11,823 | | | $ | 9,216 | |
| Deferred tax liabilities: | | | | |
| Intangible assets | | $ | (5,798) | | | $ | (5,969) | |
| Intangible and other - foreign | | (11,728) | | | (14,139) | |
| Property, plant and equipment | | (4,813) | | | (4,277) | |
| Prepaid expenses | | (247) | | | (205) | |
| Unrealized loss on hedge | | — | | | (18) | |
| Undistributed foreign earnings | | (632) | | | (1,340) | |
| Total deferred tax liabilities | | $ | (23,218) | | | $ | (25,948) | |
| Net deferred tax liability | | $ | (11,395) | | | $ | (16,732) | |
The Company expects that it is more likely than not that the results of future operations will generate sufficient taxable income to realize its domestic and foreign deferred tax assets, net of valuation allowance reserves.
The U.S. and non-U.S. components of income (loss) from continuing operations before income taxes were as follows:
| | | | | | | | | | | | | | | | | | | | |
| | Year Ended March 31, 2023 | | Year Ended March 31, 2022 | | Year Ended March 31, 2021 |
| U.S. | | $ | 17,792 | | | $ | 4,240 | | | $ | (15,818) | |
| Non-U.S. | | 31,441 | | | 24,185 | | | 15,174 | |
| Income from continuing operations | | $ | 49,233 | | | $ | 28,425 | | | $ | (644) | |
The difference between the provision for income taxes and the amount that would result from applying the U.S. statutory tax rate to income before provision for income taxes is as follows:
| | | | | | | | | | | | | | | | | | | | | | | | | | |
| | | | Year Ended March 31, 2023 | | Year Ended March 31, 2022 | | Year Ended March 31, 2021 |
| Notional U.S. federal income tax expense at statutory rate | | $ | 10,339 | | | $ | 5,969 | | | $ | (135) | |
| Adjustments to reconcile to the income tax provision: | | | | | | |
| | Impact of U.S. global intangible taxes and benefits | | (622) | | | (210) | | | (1,859) | |
| | U.S. net operating loss carry-back rate difference | | — | | | — | | | (1,470) | |
| | Russian loss not benefited | | 2,768 | | | — | | | — | |
| | South Africa divestiture | | — | | | — | | | 526 | |
| Rate difference-international subsidiaries | | 1,602 | | | 1,223 | | | 513 | |
| | Withholding on Canadian intercompany dividend | | — | | | 301 | | | — | |
| | Impact on deferred tax liability for statutory rate change | | — | | | 74 | | | 332 | |
| | Undistributed foreign earnings | | (315) | | | 713 | | | 359 | |
| | U.S. state income tax provision, net | | 654 | | | 451 | | | 48 | |
| | Charges/(benefits) related to uncertain tax positions | | 77 | | | 77 | | | 79 | |
| | Non-deductible charges | | 421 | | | 150 | | | 239 | |
| | Change in valuation allowance | | 10 | | | 34 | | | (475) | |
| | Other, net | | 633 | | | (449) | | | 322 | |
| Provision for income taxes | | $ | 15,567 | | | $ | 8,333 | | | $ | (1,521) | |
On December 22, 2017, the United States enacted significant changes to U.S. tax law following the passage and signing of H.R.1, “An Act to Provide for Reconciliation Pursuant to Titles II and V of the Concurrent Resolution on the Budget for fiscal Year 2018” (the “Tax Act”) (previously known as “The Tax Cuts and Jobs Act”). The Tax Act included significant changes to existing tax law, including a permanent reduction to the U.S. federal corporate income tax rate from 35% to 21%, a one-time repatriation tax on deferred foreign income (“Transition Tax”), deductions, credits and business-related exclusions.
Consistent with provisions allowed under the Tax Act, the net $4,007 calculated Transition Tax liability will be paid over an eight year period beginning in fiscal year 2019. At March 31, 2023, $1,640 of the Transition Tax liability is included in “Other non-current liabilities” in the consolidated balance sheets.
Given the Tax Act’s significant changes and the opportunities to repatriate cash tax free, we have reevaluated our current permanent reinvestment position. Accordingly, we no longer assert a permanent reinvestment position in most of our foreign subsidiaries. We expect to repatriate certain earnings which will be subject to withholding taxes. At March 31, 2023 we have accrued $830 as an additional deferred tax liability associated with the future repatriation of earnings from jurisdictions that withhold taxes on foreign paid dividends.
In connection with the strategic assessment related to our Russian subsidiary, the Company had losses that were primarily not benefited for tax during the year ended March 31, 2023. The net tax impact of the losses for the write-down of the Russian subsidiary was $2,768.
During the year ended March 31, 2021, the Company recorded discrete tax benefits of $1,859 related to updated Internal Revenue Service rules regarding the United States global intangible low-taxed income or ("GILTI tax") and related tax planning elections associated with the GILTI tax rule changes. Under the new rules, Thermon was able to reduce previously incurred GILTI tax under the high tax exception rules. Included with this benefit are certain tax elections that resulted in the reduction of previous tax expense.
During the year ended March 31, 2021, the Company incurred a taxable loss within its operations in the United States. As a result, the net operating loss was available to be carried back to the Company's 2016 tax year when the federal tax rate was 35%. The rate differential resulted in a discrete tax benefit of $1,470.
As of March 31, 2023, the Company had foreign tax net operating loss carry-forwards ("NOLs") of $1,863. Of this amount, $621 may be carried forward indefinitely. As of March 31, 2023, the tax years 2019 through 2022 remain open to examination by the major taxing jurisdictions to which we are subject.
At March 31, 2023, reserves for uncertain tax position consisted of uncertain tax positions related to the final Transition Tax that we determined could be overturned if the calculations were examined by tax authorities. The reserves for the Transition Tax will remain subject to examination until January 2025. No reserves are expected to be released within twelve months. Activity within our reserve for uncertain tax positions as well as the penalties and interest are recorded as a component
of the Company's income tax expense. A reconciliation of the beginning and ending amount of unrecognized tax benefits is as follows:
| | | | | | | | | | | | | | |
| | Year Ended March 31, 2023 | | Year Ended March 31, 2022 |
| Beginning balance | $ | 885 | | | $ | 808 | |
| Release of reserve | — | | | — | |
| | | |
| | | |
| Interest and penalties on prior reserves | 77 | | | 77 | |
| Reserve for uncertain income taxes - included in "Other non-current liabilities" | $ | 962 | | | $ | 885 | |
19. Segment Information
We maintain four reportable segments based on four geographic countries or regions in which we operate: (i) United States and Latin America ("US-LAM"), (ii) Canada, (iii) Europe, Middle East and Africa ("EMEA") and (iv) Asia-Pacific ("APAC"). Within our four reportable segments, our core products and services are focused on the following markets: chemical and petrochemical, oil, gas, power generation, commercial, rail and transit, energy transition/decarbonization and general industries and other, which we refer to as our "key end markets." We offer a full suite of products (heating units, heating cables, heated blankets, temporary power solutions, and tubing bundles), services (engineering, installation and maintenance services) and software (design optimization and wireless and network control systems) required to deliver comprehensive solutions to some of the world's largest and most complex projects. Profitability within our segments is measured by operating income. Profitability can vary in each of our reportable segments based on the competitive environment within the region, the level of corporate overhead, such as the salaries of our senior executives, and the level of research and development and marketing activities in the region, as well as the mix of products and services. For purposes of this note, revenue is attributed to individual countries or regions on the basis of the physical location and jurisdiction of organization of the subsidiary that invoices the material and services.
Total sales to external customers, inter-segment sales, depreciation expense, amortization expense, income from operations, property, plant, and equipment, net of accumulated depreciation, and total assets classified by major geographic area in which the Company operates are as follows:
| | | | | | | | | | | | | | | | | | | | |
| | Year Ended March 31, 2023 | | Year Ended March 31, 2022 | | Year Ended March 31, 2021 |
| Sales to External Customers: | | | | | | |
| United States and Latin America | | $ | 209,154 | | | $ | 154,187 | | | $ | 95,441 | |
| Canada | | 153,968 | | | 115,442 | | | 90,853 | |
| Europe, Middle East and Africa | | 43,157 | | | 54,737 | | | 54,219 | |
| Asia-Pacific | | 34,311 | | | 31,308 | | | 35,668 | |
| | | $ | 440,590 | | | $ | 355,674 | | | $ | 276,181 | |
| Inter-segment Sales: | | | | | | |
| United States and Latin America | | $ | 42,657 | | | $ | 40,169 | | | $ | 40,793 | |
| Canada | | 17,715 | | | 11,629 | | | 7,272 | |
| Europe, Middle East and Africa | | 1,409 | | | 1,683 | | | 2,003 | |
| Asia-Pacific | | 2,033 | | | 1,325 | | | 1,221 | |
| | $ | 63,814 | | | $ | 54,806 | | | $ | 51,289 | |
| Depreciation Expense: | | | | | | |
| United States and Latin America | | $ | 4,845 | | | $ | 5,729 | | | $ | 6,290 | |
| Canada | | 4,423 | | | 5,117 | | | 4,454 | |
| Europe, Middle East and Africa | | 366 | | | 390 | | | 341 | |
| Asia-Pacific | | 150 | | | 179 | | | 192 | |
| | $ | 9,784 | | | $ | 11,415 | | | $ | 11,277 | |
| Amortization of Intangibles: | | | | | | |
| United States and Latin America | | $ | 2,175 | | | $ | 1,145 | | | $ | 1,464 | |
| Canada | | 7,085 | | | 7,472 | | | 7,301 | |
| Europe, Middle East and Africa | | 84 | | | 94 | | | 453 | |
| Asia-Pacific | | 103 | | | 79 | | | 227 | |
| | $ | 9,447 | | | $ | 8,790 | | | $ | 9,445 | |
| Income/(Loss) from Operations: | | | | | | |
| United States and Latin America | | $ | 38,808 | | | $ | 9,699 | | | $ | (9,490) | |
| Canada | | 36,173 | | | 22,913 | | | 15,242 | |
| Europe, Middle East and Africa | | (17,488) | | | 6,974 | | | 3,181 | |
| Asia-Pacific | | 5,431 | | | 4,559 | | | 3,917 | |
| Unallocated: | | | | | | |
| Public company costs | | (1,780) | | | (1,937) | | | (1,716) | |
| Stock compensation | | (5,954) | | | (3,803) | | | (3,728) | |
| | | $ | 55,190 | | | $ | 38,405 | | | $ | 7,406 | |
| | | | | | |
| | March 31, 2023 | | March 31, 2022 | | |
| Property, Plant and Equipment, net: | | | | | | |
| United States and Latin America | | $ | 31,918 | | | $ | 31,919 | | | |
| Canada | | 28,369 | | | 30,686 | | | |
| Europe, Middle East and Africa | | 2,366 | | | 2,796 | | | |
| Asia-Pacific | | 635 | | | 638 | | | |
| | $ | 63,288 | | | $ | 66,039 | | | |
| Total Assets: | | | | | | |
| United States and Latin America | | $ | 270,404 | | | $ | 241,421 | | | |
| Canada | | 287,221 | | | 296,459 | | | |
| Europe, Middle East and Africa | | 57,680 | | | 67,608 | | | |
| Asia-Pacific | | 34,324 | | | 31,181 | | | |
| | $ | 649,629 | | | $ | 636,669 | | | |
At March 31, 2023 and 2022, non-current deferred tax assets of $10,363 and $7,061 respectively, were applicable to the United States.
Capital expenditures by geographic area were as follows:
| | | | | | | | | | | | | | | | | | | | |
| | Year-Ended March 31, 2023 | | Year-Ended March 31, 2022 | | Year-Ended March 31, 2021 |
| Capital Expenditures: | | | | | | |
| United States and Latin America | | $ | 4,268 | | | $ | 1,267 | | | $ | 3,075 | |
| Canada | | 4,636 | | | 3,593 | | | 4,866 | |
| Europe, Middle East and Africa | | 278 | | | 288 | | | 68 | |
| Asia-Pacific | | 271 | | | 72 | | | 123 | |
| | | $ | 9,453 | | | $ | 5,220 | | | $ | 8,132 | |
20. Subsequent Events
No subsequent events have been identified for the fiscal year ended March 31, 2023.
ITEM 9. CHANGES IN AND DISAGREEMENTS WITH ACCOUNTANTS ON ACCOUNTING AND FINANCIAL DISCLOSURE
None.
ITEM 9A. CONTROLS AND PROCEDURES
Disclosure Controls and Procedures
Under the supervision and with the participation of the Company's management, including its Chief Executive Officer and Chief Financial Officer, the Company has evaluated the effectiveness of the design and operation of its disclosure controls and procedures pursuant to Rule 13a-15(b) under the Exchange Act as of the end of the period covered by this annual report. Based on that evaluation, the Company's Chief Executive Officer and Chief Financial Officer have concluded that, as of the end of the period covered by this annual report, these disclosure controls and procedures were effective to provide reasonable assurance that information required to be disclosed in the reports filed or submitted under the Exchange Act is recorded, processed, summarized and reported within the time periods specified in the SEC's rules and forms, and that such information is accumulated and communicated to the Company's management to allow timely decisions regarding required disclosure.
Management's Annual Report on Internal Control Over Financial Reporting
We, as management, are responsible for establishing and maintaining adequate internal control over the Company's financial reporting, as such term is defined in Rule 13a-15(f) under the Exchange Act. Our internal control system was designed to provide reasonable assurance regarding the reliability of financial reporting and the preparation of financial statements for external purposes in accordance with generally accepted accounting principles and includes those policies and procedures that: (1) pertain to the maintenance of records that in reasonable detail accurately and fairly reflect the transactions and dispositions of the assets of the Company; (2) provide reasonable assurance that transactions are recorded as necessary to permit preparation of financial statements in accordance with generally accepted accounting principles, and that receipts and expenditures of the Company are being made only in accordance with authorizations of management and directors of the Company; and (3) provide reasonable assurance regarding prevention or timely detection of unauthorized acquisition, use or disposition of the Company’s assets that could have a material effect on the financial statements. All internal control systems, no matter how well designed, have inherent limitations. Therefore, even those systems determined to be effective can provide only reasonable assurance with respect to financial statement preparation and presentation.
Management assessed the effectiveness of the Company’s internal control over financial reporting as of March 31, 2023, based on the criteria set forth in the Internal Control - Integrated Framework (2013) issued by the Committee of Sponsoring Organizations of the Treadway Commission ("COSO").
Based on this assessment, management has concluded that, as of March 31, 2023, our internal control over financial reporting is effective. The scope of management's assessment of the effectiveness of its internal control over financial reporting did not include a similar assessment of such controls at Powerblanket, which we acquired in fiscal 2023. Powerblanket comprised approximately 6% of our total assets at March 31, 2023, and 4% of our total revenue in fiscal 2023.
KPMG LLP, the independent registered public accounting firm that audited the Company’s consolidated financial statements as of and for the year ended March 31, 2023, included in this annual report, has issued an attestation report on the effectiveness of the Company’s internal control over financial reporting as of March 31, 2023. The report is included in Item 8 of this annual report.
Changes in Internal Control over Financial Reporting
There have been no changes in our internal control over financial reporting during the quarter ended March 31, 2023, that have materially affected, or are reasonably likely to materially affect, our internal control over financial reporting.
ITEM 9B. OTHER INFORMATION
None.
ITEM 9C. DISCLOSURE REGARDING FOREIGN JURISDICTIONS THAT PREVENT INSPECTIONS
None.
PART III
ITEM 10. DIRECTORS, EXECUTIVE OFFICERS AND CORPORATE GOVERNANCE
Information About Our Executive Officers
The following table and biographies set forth certain information about our current executive officers (collectively, the "Executive Officers"). The names, positions and ages of the Executive Officers as of May 25, 2023, are listed below. Our Executive Officers are appointed by the Board and serve at the discretion of the Board. There are no family relationships among these officers, nor any arrangements or understandings between any Executive Officer and any other person pursuant to which the officer was selected.
| | | | | | | | | | | | | | |
| Executive Officer | | Title | | Age |
| Bruce Thames | | President & Chief Executive Officer | | 60 |
| Kevin Fox | | Senior Vice President, Chief Financial Officer | | 39 |
| David Buntin | | Senior Vice President, Thermon Heat Tracing | | 53 |
| Thomas Cerovski | | Senior Vice President, Global Sales | | 51 |
| Candace Harris-Peterson | | Vice President, Human Resources | | 44 |
| Mark Roberts | | Senior Vice President, Global Engineering and Project Services | | 62 |
| Roberto Kuahara | | Senior Vice President, Global Operations | | 57 |
| Ryan Tarkington | | General Counsel & Corporate Secretary | | 42 |
Bruce A. Thames joined Thermon in April 2015 as Executive Vice President and Chief Operating Officer. He was promoted to President and Chief Executive Officer and appointed as a member of the Board on April 1, 2016. Prior to joining Thermon, Mr. Thames was Senior Vice President and Chief Operating Officer of TD Williamson in Tulsa, Oklahoma, a position he held since 2012. TD Williamson manufactures and delivers a portfolio of solutions to the owners and operators of pressurized piping systems for onshore and offshore applications. He joined TD Williamson in 2005 as Vice President, North America and also served as Vice President and General Manager, Eastern Hemisphere from 2010 to 2012. Mr. Thames began his career with Cooper Industries (formerly Intool), where he spent twelve years in various roles within the product engineering, marketing and operations groups. Mr. Thames then joined GE Energy (formerly Dresser Flow Solutions) ("Dresser") and served primarily as the Director of North American Operations and Product Director for Ball Valves globally for Dresser's Valve Group during his tenure from 2002 to 2005. Mr. Thames holds a B.S. in Mechanical Engineering from the University of Texas at Austin. Mr. Thames brings extensive leadership skills, international acumen, product innovation, operational experience in lean/six sigma and industry knowledge to the Board.
Kevin Fox joined the Company in March 2019 as Vice President, Corporate Development, in which he managed the Corporate Development, Investor Relations and the Global Marketing activities of the Company. He was promoted to Senior Vice President, Chief Financial Officer in February 2021. Prior to joining Thermon, Mr. Fox served in various roles of increasing responsibility in strategy, corporate development and finance with General Electric from 2006 to 2019. Mr. Fox holds a B.A. from Boston College and a M.B.A. from Northwestern University’s Kellogg School of Management.
Thomas Cerovski joined the Company in January 2019 as Senior Vice President, Global Sales, where Mr. Cerovski manages the Company's profit and loss business units and commercial organization. Prior to joining the Company, from 2018 until 2019, Mr. Cerovski was the Senior Vice President, Global Sales and Business Development for Trojan Battery Company, a leading manufacturer of deep-cycle batteries. From 2013 through 2018, Mr. Cerovski held various positions at Dover Corporation, a conglomerate manufacturer of industrial products, including Vice President and General Manager, Dispenser Business Unit, and Vice President, Product and Technology Services, Wayne Fueling Systems. Prior to joining Dover Corporation, Mr. Cerovski served for fourteen (14) years in various positions with General Electric Company. Mr. Cerovski began his career at the Nuclear Regulatory Commission. Mr. Cerovski brings more than twenty-five (25) years of energy industry leadership experience in positions ranging from engineering, product management, sales, business development, and business unit management. Mr. Cerovski holds a B.S. from Montana State University, a M.S from Purdue University, and a M.B.A. from George Washington University.
Roberto Kuahara joined the Company in February 2022 as Senior Vice President, Operations. Prior to joining the Company, Mr. Kuahara served as the Vice President of Manufacturing and Supply Chain, Continuous Improvement and EHS of SPM Oil & Gas, Inc., a subsidiary of Caterpillar, Inc. From 2011 to January 2021, Mr. Kuahara held various positions at the oil and gas division of Weir Group plc, including the Divisional Vice President of Operations, Continuous Improvement and EHS until the sale of the oil and gas division to Caterpillar, Inc. in February 2021. Prior to joining the Weir Group plc, Mr.
Kuahara held various positions in the automotive manufacturing industry, including Ford Motor Company, Volkswagen and Dana Corporation when he was resident at Toyota Motor Company. Mr. Kuahara brings over thirty (30) years of experience in global multi-site manufacturing operations. Mr. Kuahara holds a B.S. in Mechanical Engineering from the University of Mackenzie.
Mark Roberts joined the Company in October 2016 as Vice President of Global Engineering and Project Services. In May 2021, Mr. Roberts was promoted to Senior Vice President, Thermon Heating Systems and Engineering. Prior to joining the Company, from September 2011 to September 2015, Mr. Roberts served as Vice President, Executive Vice President and President of Audubon Engineering Company, LLC, a professional Engineering Firm. During his thirty-five (35) year career in the energy industry, Mr. Roberts has held executive and management positions within technical sales, business development, engineering and business unit management. Mr. Roberts holds a B.S. in chemical engineering from The University of Texas at Austin.
David Buntin joined the Company in January 2017 as Senior Vice President, Research and Development. In May 2020, Mr. Buntin was promoted to Senior Vice President, Thermon Heat Tracing and R&D. Prior to joining the Company, from 2007 to 2016, Mr. Buntin served as Chief Operating Officer and Vice President Engineering for Enovation Controls, Inc., a company that provides instrumentation, displays, controls and fuel systems for natural gas engines and compressors as well as industrial and marine equipment. Before joining Enovation Controls, Inc., from 1998 to 2007, Mr. Buntin served as the Vice President of Engineering and Services for SecureLogix Corporation, a successful high-tech startup providing telephony and voice-over-IP security solutions. Prior to SecureLogix, from 1994 to 1998, Mr. Buntin served in various engineering roles of increasing responsibility with Southwest Research Institute. Mr. Buntin holds a B.S. in electrical engineering from Baylor University and a M.S. in electrical engineering from Texas A&M University.
Candace Harris-Peterson joined the Company in January 2017 as Vice President of Human Resources. Prior to joining the Company, from 2006 to 2016, Ms. Peterson was the Senior Business Partner, Global Sales and Services for TD Williamson, Inc., a global solutions provider to the owners and operators of pressurized piping systems for onshore and offshore applications. Ms. Peterson holds a B.A. in organizational leadership from Chapman University in Orange, California.
Ryan Tarkington joined the Company in February 2019 as General Counsel and Corporate Secretary. In May 2022, Mr. Tarkington was promoted to Senior Vice President, General Counsel and Corporate Secretary. Prior to joining the Company, from 2011 to 2019, Mr. Tarkington served in various capacities with several international companies in the offshore drilling industry, including as Senior Counsel for Rowan Companies plc from 2017 through 2019, as Associate General Counsel for Paragon Offshore plc from 2014 through 2017 and as Senior Counsel for Transocean Ltd. from 2011 through 2014. Mr. Tarkington began his career at the law firm of Vinson & Elkins L.L.P. Mr. Tarkington holds a B.A. from Rice University and a J.D. from The University of Texas School of Law.
Information concerning our directors will appear in our proxy statement for the 2022 Annual Meeting of Stockholders to be filed pursuant to Regulation 14A of the Exchange Act (Regulation 14A) on or before June 22, 2022 (the “2021 Proxy Statement”) under the caption “Directors.” Such information is incorporated herein by reference.
Information concerning our Audit, Human Capital Management and Compensation, Finance, and Nominating and Corporate Governance Committees will appear in 2022 Proxy Statement under the caption “Corporate Governance.” Such information is incorporated herein by reference. Our committee charters and corporate governance guidelines are available on our Investor Relations website located at http://ir.thermon.com.
Code of Business Conduct and Ethics
We have adopted a written code of business conduct and ethics, which we refer to as our “code of conduct,” that applies to all of our employees, officers and directors. Our code of conduct is available on our Investor Relations website located at http://ir.thermon.com. Stockholders can also obtain a free copy of our code of conduct by writing to the General Counsel, Thermon Group Holdings, Inc., 7171 Southwest Parkway, Building 300, Suite 200, Texas 78735. We will post any amendments to our code of conduct, and any waivers that are required to be disclosed pursuant to SEC or NYSE rules, on our website.
ITEM 11. EXECUTIVE COMPENSATION
Information regarding executive and director compensation is incorporated by reference to the "Compensation Discussion and Analysis" section of our Definitive Proxy Statement for the 2023 Annual Meeting of Stockholders.
The material incorporated herein by reference to the information set forth under the "Compensation Committee Report" in our Definitive Proxy Statement for the 2023 Annual Meeting of Stockholders shall be deemed furnished, and not filed, in this Annual Report on Form 10-K and shall not be deemed incorporated by reference into any of our filings under the Securities Act of 1933 or the Securities Exchange Act of 1934 as a result of this furnishing, except to the extent that we have specifically incorporated such materials by reference.
Information regarding compensation committee interlocks and insider participation is incorporated herein by reference to the information under the heading "Corporate Governance-Compensation Committee Interlocks and Insider Participation" section of our Definitive Proxy Statement for the 2023 Annual Meeting of Stockholders.
ITEM 12. SECURITY OWNERSHIP OF CERTAIN BENEFICIAL OWNERS AND MANAGEMENT AND RELATED STOCKHOLDER MATTERS
Information regarding security ownership of certain beneficial owners and management is incorporated herein by reference to the "Security Ownership of Certain Beneficial Owners and Management" section of our Definitive Proxy Statement for the 2023 Annual Meeting of Stockholders.
Information related to compensation plans under which our equity securities are authorized for issuance as of March 31, 2023 is set forth in the table below.
Equity Compensation Plan Information
The following table sets forth information regarding our equity compensation plans as of March 31, 2023. Specifically, the table provides information regarding our stock plans, described elsewhere in this annual report.
| | | | | | | | | | | | | | | | | | | | | | | |
| Plan Category | | Number of securities to be issued upon exercise of outstanding equity awards | | Weighted-average exercise price of outstanding options | | Number of securities remaining available for future issuances under equity compensation plans (1) |
| | | | | | |
Equity compensation plans approved by security holders (2) | | 730,411 | | | $ | 16.33 | | | 750,330 | |
| Equity plans not approved by security holders | | — | | | — | | | — | |
Total(3) | | 730,411 | | | | | 750,330 | |
(1) Excludes securities reflected in the column entitled "Number of securities to be issued upon exercise of outstanding equity awards."
(2) On April 8, 2011, our board of directors and pre-IPO stockholders approved the Thermon Group Holdings, Inc. 2011 Long-Term Incentive Plan ("2011 LTIP"). The 2011 LTIP authorized the issuance of 2,893,341 equity awards. On May 21, 2020, the Board of Directors approved the Thermon Group Holdings, Inc. 2020 Long-Term Incentive Plan ("2020 LTIP"). The 2020 LTIP made available 1,400,000 shares of the Company's common stock that may be awarded to employees, directors, or non-employee contractor's compensation in the form of stock options or restricted stock awards.
(3) At March 31, 2023, the Company had outstanding under the LTIP: (i) 74,366 stock options, with a weighted average exercise price of $16.33, (ii) 336,254 unvested restricted stock units, with a weighted average grant date fair value of $16.12, and (iii) 319,791 performance units (assuming satisfaction of the performance metric at target and 639,582 at maximum), with a weighted average grant date fair value of $18.93.
ITEM 13. CERTAIN RELATIONSHIPS AND RELATED TRANSACTIONS, AND DIRECTOR INDEPENDENCE
Information regarding certain relationships and related transactions and director independence is incorporated herein by reference to the "Certain Relationships and Related Party Transactions" and "Corporate Governance-Director Independence" sections, respectively, of our Definitive Proxy Statement for the 2023 Annual Meeting of Stockholders.
ITEM 14. PRINCIPAL ACCOUNTANT FEES AND SERVICES
Our independent registered public accounting firm is KPMG LLP, located in Austin, Texas, PCAOB ID:185. Information regarding our principal accountant fees and services is incorporated herein by reference to the "Audit and Non-Audit Fees" section of our Definitive Proxy Statement for the 2023 Annual Meeting of Stockholders.
PART IV
ITEM 15. EXHIBITS AND FINANCIAL STATEMENT SCHEDULES
The following documents are filed as a part of this annual report:
1. Financial Statements: Included herein at Item 8.
2. Financial Statement Schedules: None. Financial statement schedules have been omitted because the required information is included in our consolidated financial statements contained elsewhere in this annual report.
3. Exhibits: See the Exhibit Index below. Each management contract and compensatory plan or arrangement required to be filed as an exhibit to this annual report is identified in the Exhibit Index by a single asterisk following its exhibit number.
Certain of the agreements included as exhibits to this annual report contain representations and warranties by each of the parties to the applicable agreement. These representations and warranties have been made solely for the benefit of the other parties to the applicable agreement and:
•should not in all instances be treated as categorical statements of fact, but rather as a way of allocating the risk to one of the parties if those statements prove to be inaccurate;
•have been qualified by disclosures that were made to the other party in connection with the negotiation of the applicable agreement, which disclosures are not necessarily reflected in such agreement;
•may apply standards of materiality in a way that is different from what may be viewed as material to you or other investors; and
•were made only as of the date of the applicable agreement or such other date or dates as may be specified in such agreement and are subject to more recent developments.
The registrant acknowledges that, notwithstanding the inclusion of the foregoing cautionary statements, it is responsible for considering whether additional specific disclosures of material information regarding material contractual provisions are required to make the statements in this annual report not misleading.
EXHIBIT INDEX
| | | | | | | | |
Exhibit
Number | | Description |
| | | |
| 3.1 | | |
| | |
| 3.2 | | |
| | |
| 4.1 | | |
| | |
| 4.2 | | |
| | |
| 10.1 | | |
| | |
| 10.2 | | |
| | |
| 10.3 | | Amendment No. 2 to Credit Agreement, Amendment No. 1 to the Guarantee and Collateral Agreement and Amendment No. 1 to the Canadian Guarantee and Collateral Agreement, dated as of March 7, 2023, by and among Thermon Group Holdings, Inc., Thermon Holding Corp., Thermon Canada, Inc. JPMorgan Chase Bank, N.A. and the Lenders party thereto (incorporated by reference to Exhibit 10.1 to the registrant's Current Report on Form 8-K filed March 9, 2023) |
| | |
| 10.4 | | |
| | |
| 10.5 | | |
| | |
| 10.6 | | Amendment No. 2, dated as of May 4, 2012, to Amended and Restated Securityholder Agreement, dated as of April 30, 2010, as previously Amended by Amendment No. 1, dated as of April 1, 2011 and effective as of May 10, 2011, among Thermon Group Holdings, Inc. and the other parties identified therein (incorporated by reference to Exhibit 10.1 to the registrant's Current Report on Form 8-K of Thermon Group Holdings, Inc. filed on May 10, 2012) |
| | |
| 10.7† | | |
| | |
| 10.8† | | |
| | |
| 10.9† | | |
| | |
| 10.10† | | |
| | |
| 10.11† | | |
| | |
| 10.12† | | |
| | |
| 10.13† | | |
| | |
| 10.14† | | |
| | |
| 10.15† | | |
| | |
| | | | | | | | |
| 10.16† | | |
| | |
| 10.17† | | |
| | |
| 10.18† | | |
| | |
| 10.19† | | |
| | |
| 10.20† | | |
| | |
| 10.21† | | |
| | |
| 10.22† | | |
| | |
| 10.23† | | |
| | |
| 10.24†* | | |
| | |
| 21.1* | | |
| | |
| 23.1* | | |
| | |
| 31.1* | | |
| | | |
| 31.2* | | |
| | |
| 32.1* | | |
| | |
| 32.2* | | |
| | | |
| 101* | | Interactive Data Files Pursuant to Rule 405 of Regulation S-T: (i) Consolidated Balance Sheets, (ii) Consolidated Statements of Operations and Comprehensive Income (Loss), (iii) Consolidated Statements of Shareholders'/Members' Equity, (iv) Consolidated Statements of Cash Flows, and (v) Notes to Consolidated Financial Statements |
| | |
| 104* | | Cover Page Interactive Data File (formatted as Inline XBRL and contained in Exhibit 101)
|
__________________________________
+ The schedules to this exhibit have been omitted in accordance with Regulation S-K Item 601(b)(2). A copy of any
omitted schedule will be furnished to the Securities and Exchange Commission upon request.
† Management contract and compensatory plan or arrangement
* Filed herewith
ITEM 16. FORM 10-K SUMMARY
None.
SIGNATURE
Pursuant to the requirements of Section 13 or 15(d) of the Securities Exchange Act of 1934, the registrant has duly caused this report to be signed on its behalf by the undersigned, thereunto duly authorized.
| | | | | | | | |
| | THERMON GROUP HOLDINGS, INC. (registrant) |
| Date: May 25, 2023 | By: | /s/ Kevin Fox |
| | | Kevin Fox |
| | | Senior Vice President, Chief Financial Officer
(Principal Financial and Principal Accounting Officer) |
Pursuant to the requirements of the Securities Exchange Act of 1934, this annual report has been signed below by the following persons on behalf of the registrants and in the capacities and on the date indicated.
| | | | | | | | | | | | | | | | | |
| Date | | Title | | | Signatures |
| May 25, 2023 | | President and Chief Executive Officer | | By: | /s/ Bruce Thames |
| | (Principal Executive Officer); Director | | | Bruce Thames |
| | | | | |
| May 25, 2023 | | Chief Financial Officer, Senior Vice President | | By: | /s/ Kevin Fox |
| | (Principal Financial and Principal Accounting Officer) | | | Kevin Fox |
| | | | | |
| May 25, 2023 | | Chairman of the Board | | By: | /s/ John T. Nesser III |
| | | | | John T. Nesser III |
| | | | | |
| May 25, 2023 | | Director | | By: | /s/ John U. Clarke |
| | | | | John U. Clarke |
| | | | | |
| May 25, 2023 | | Director | | By: | /s/ Linda Dalgetty |
| | | | | Linda Dalgetty |
| | | | | |
| May 25, 2023 | | Director | | By: | /s/ Roger L. Fix |
| | | | | Roger L. Fix |
| | | | | |
| May 25, 2023 | | Director | | By: | /s/ Marcus J. George |
| | | | | Marcus J. George |
| | | | | |
| May 25, 2023 | | Director | | By: | /s/ Kevin J. McGinty |
| | | | | Kevin J. McGinty |
| | | | | |
| May 25, 2023 | | Director | | By: | /s/ Dr. Angela Strzelecki |
| | | | | Dr. Angela Strzelecki |