R 226
G 35
B 26
R 255
G 255
B 255
R 00
G 00
B 00
R 239
G 66
B 67
R 199
G 33
B 39
R 154
G 29
B 32
R 207
G 205
B 206
R 160
G 158
B 159
R 70
G 70
B 71
R 15
G 72
B 120
R 21
G 93
B 160
R 58
G 135
B 193
1
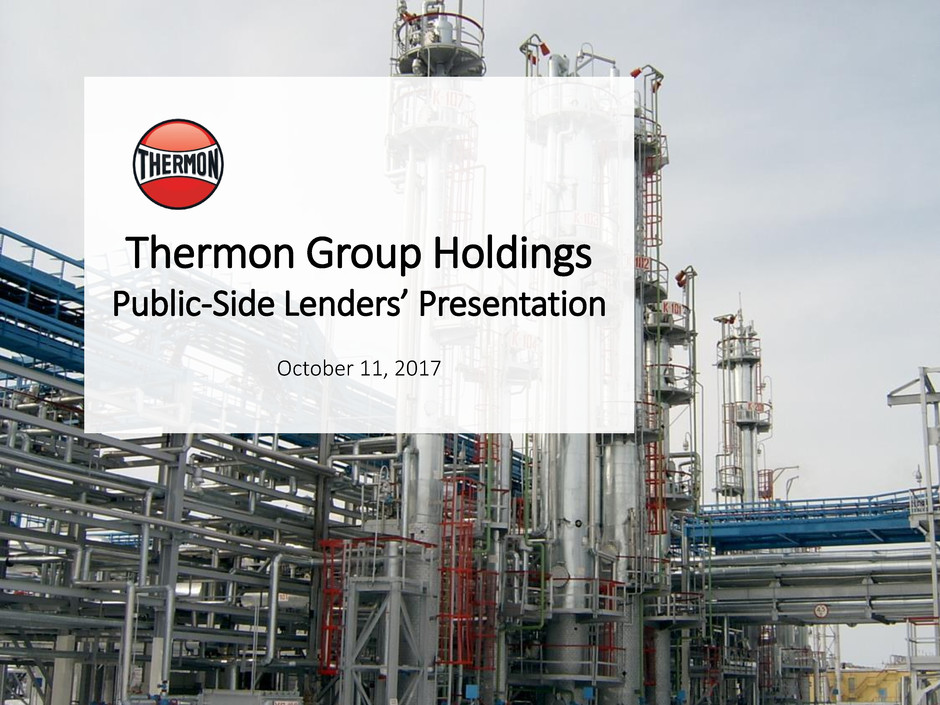
Thermon Group Holdings
Public-Side Lenders’ Presentation
October 11, 2017
R 226
G 35
B 26
R 255
G 255
B 255
R 00
G 00
B 00
R 239
G 66
B 67
R 199
G 33
B 39
R 154
G 29
B 32
R 207
G 205
B 206
R 160
G 158
B 159
R 70
G 70
B 71
R 15
G 72
B 120
R 21
G 93
B 160
R 58
G 135
B 193
2
Disclaimer
Certain statements in this presentation and responses to various questions may constitute forward-looking statements within the
meaning of the U.S. federal securities laws. These forward-looking statements include, without limitation, statements regarding Thermon
Group Holdings, Inc.’s (the “Company,” “Thermon,” “we,” “our” or “us”) industry, business strategy, plans, goals and expectations
concerning our market position, future operations, margins, profitability, capital expenditures, liquidity and capital resources and other
financial and operating information. When used, the words “anticipate,” “assume,” “believe,” “budget,” “continue,” “could,” “estimate,”
“expect,” “intend,” “may,” “plan,” “potential,” “predict,” “project,” “forecast,” “will,” “future” and similar terms and phrases are intended
to identify forward-looking statements. Forward-looking statements reflect our current expectations regarding future events, results or
outcomes. These expectations may or may not be realized. Some of these expectations may be based upon assumptions, data or
judgments that prove to be incorrect. In addition, our business and operations involve numerous risks and uncertainties, many of which
are beyond our control, which could result in our expectations not being realized or otherwise materially affect our financial condition,
results of operations and cash flows. Our forward-looking statements are based on management’s knowledge and reasonable
expectations on the date hereof and are not guarantees of future performance. Actual results and future performance may differ
materially from those suggested in any forward-looking statements due to a variety of factors, including those described under the
caption “Risk Factors” in our Annual Report on Form 10-K filed with the Securities and Exchange Commission on or about May 31, 2017.
We do not intend to update these statements unless we are required to do so under applicable securities laws.
The trademarks included herein are the property of the owners thereof and are used for reference purposes only. Such use should not be
construed as an endorsement of the products or services of the Company.
The information and opinions contained in this document are provided as at the date of this presentation and are subject to change
without notice. This document has not been approved by any competent regulatory or supervisory authority.
R 226
G 35
B 26
R 255
G 255
B 255
R 00
G 00
B 00
R 239
G 66
B 67
R 199
G 33
B 39
R 154
G 29
B 32
R 207
G 205
B 206
R 160
G 158
B 159
R 70
G 70
B 71
R 15
G 72
B 120
R 21
G 93
B 160
R 58
G 135
B 193
3
Presenters
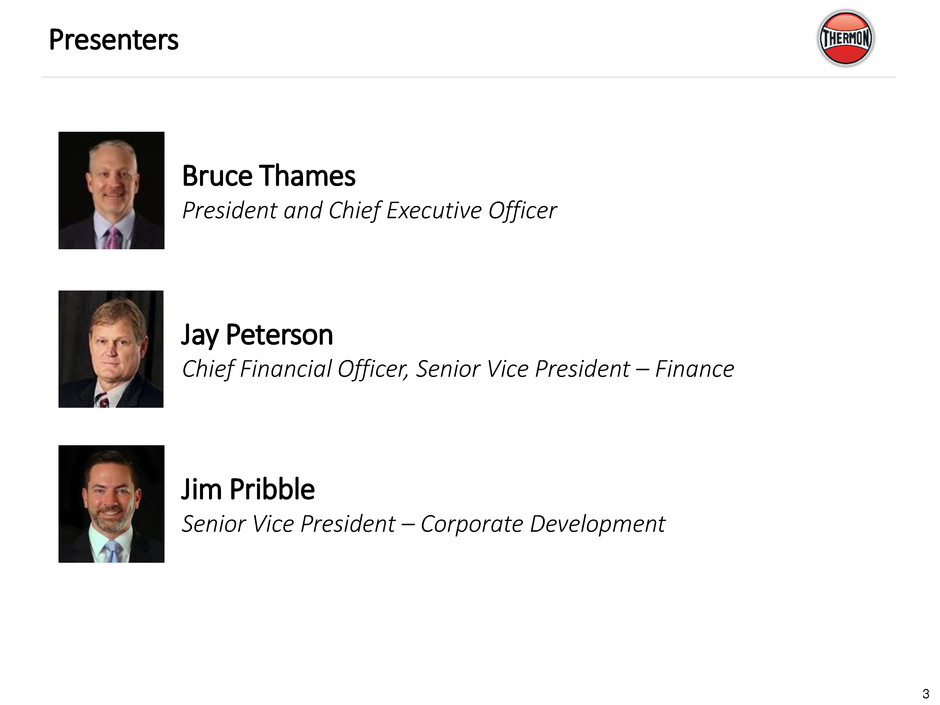
Bruce Thames
President and Chief Executive Officer
Jay Peterson
Chief Financial Officer, Senior Vice President – Finance
Jim Pribble
Senior Vice President – Corporate Development
R 226
G 35
B 26
R 255
G 255
B 255
R 00
G 00
B 00
R 239
G 66
B 67
R 199
G 33
B 39
R 154
G 29
B 32
R 207
G 205
B 206
R 160
G 158
B 159
R 70
G 70
B 71
R 15
G 72
B 120
R 21
G 93
B 160
R 58
G 135
B 193
4
Agenda
Transaction Overview
Company and Industry Overview
Key Credit Highlights
Historical Financial Performance
Appendix
R 226
G 35
B 26
R 255
G 255
B 255
R 00
G 00
B 00
R 239
G 66
B 67
R 199
G 33
B 39
R 154
G 29
B 32
R 207
G 205
B 206
R 160
G 158
B 159
R 70
G 70
B 71
R 15
G 72
B 120
R 21
G 93
B 160
R 58
G 135
B 193
5
Executive Summary
Thermon will combine with CCI Thermal, creating the world’s leader in industrial process heating
1
2
3
4
Thermon Group Holdings, Inc. (“Thermon”, “THR” or the “Company”), headquartered in San Marcos, TX and
publicly traded on the NYSE (NYSE: THR), engineers and manufactures engineered industrial process heating
solutions
The Company’s products provide an external heat source to pipes, vessels and instruments for the purposes of freeze
protection, temperature maintenance, environmental monitoring and surface snow and ice melting
Thermon signed a definitive agreement on October 4, 2017 to acquire 100% of CCI Thermal Technologies Inc. (“CCI
Thermal” or the “Target”), an Edmonton, AB based privately held company
CCI Thermal provides an assortment of market-leading brands in the process heating space where Thermon does not
currently play. While the business currently derives 95% of its revenue from Canada and the U.S., CCI Thermal has
obtained many global certifications (including EAC) – preparing the Target for sales in foreign markets
The all-cash purchase price will be CAD$258 million (USD$206 million based on USD/CAD exchange rate of 1.25 as of
10/10/2017), which represents an 11.2x purchase multiple based on Target LTM August 2017 adjusted EBITDA of
CAD$23 million (USD$18 million)
This translates to an 8.8x purchase multiple based on CCI’s forward 2018 budgeted adj. EBITDA of CAD$29 for the
period ending July 2018 (USD$23)
Thermon believes it will realize approximately USD$2 million of cost synergies. Further, the Company should realize
considerable revenue synergies through solution-selling and expanding CCI Thermal’s footprint into new
geographies where Thermon has a dedicated presence
Pro forma total net leverage will be 3.4x based on USD$61 million pro forma adjusted EBITDA
R 226
G 35
B 26
R 255
G 255
B 255
R 00
G 00
B 00
R 239
G 66
B 67
R 199
G 33
B 39
R 154
G 29
B 32
R 207
G 205
B 206
R 160
G 158
B 159
R 70
G 70
B 71
R 15
G 72
B 120
R 21
G 93
B 160
R 58
G 135
B 193
6
Transaction Overview
R 226
G 35
B 26
R 255
G 255
B 255
R 00
G 00
B 00
R 239
G 66
B 67
R 199
G 33
B 39
R 154
G 29
B 32
R 207
G 205
B 206
R 160
G 158
B 159
R 70
G 70
B 71
R 15
G 72
B 120
R 21
G 93
B 160
R 58
G 135
B 193
7
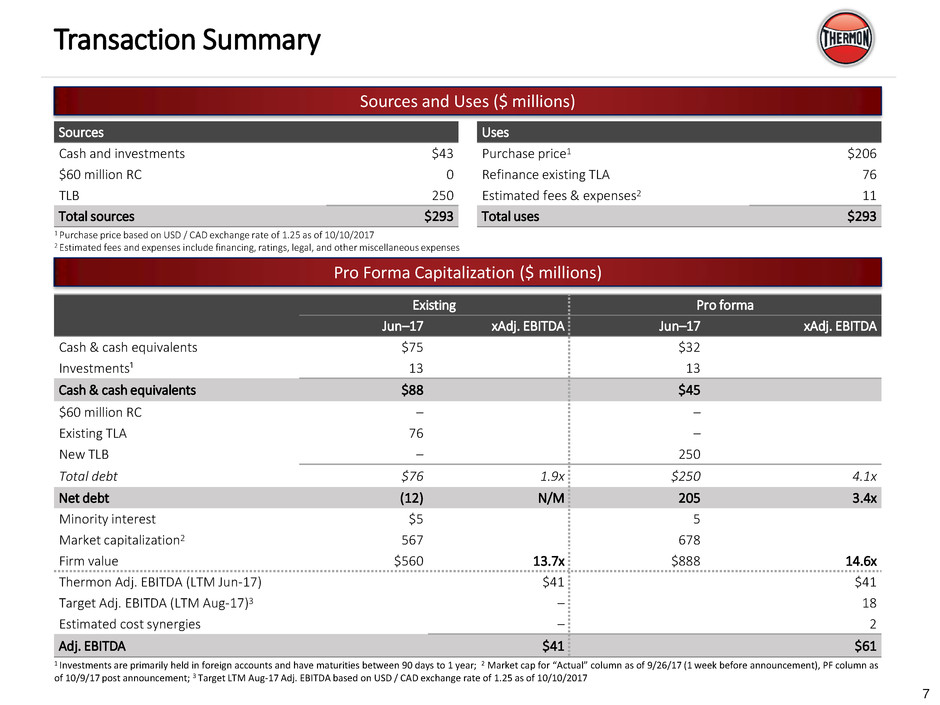
Transaction Summary
Sources and Uses ($ millions)
Pro Forma Capitalization ($ millions)
1 Purchase price based on USD / CAD exchange rate of 1.25 as of 10/10/2017
2 Estimated fees and expenses include financing, ratings, legal, and other miscellaneous expenses
Sources
Cash and investments $43
$60 million RC 0
TLB 250
Total sources $293
Uses
Purchase price1 $206
Refinance existing TLA 76
Estimated fees & expenses2 11
Total uses $293
1 Investments are primarily held in foreign accounts and have maturities between 90 days to 1 year; 2 Market cap for “Actual” column as of 9/26/17 (1 week before announcement), PF column as
of 10/9/17 post announcement; 3 Target LTM Aug-17 Adj. EBITDA based on USD / CAD exchange rate of 1.25 as of 10/10/2017
Existing Pro forma
Jun–17 xAdj. EBITDA Jun–17 xAdj. EBITDA
Cash & cash equivalents $75 $32
Investments¹ 13 13
Cash & cash equivalents $88 $45
$60 million RC – –
Existing TLA 76 –
New TLB – 250
Total debt $76 1.9x $250 4.1x
Net debt (12) N/M 205 3.4x
Minority interest $5 5
Market capitalization2 567 678
Firm value $560 13.7x $888 14.6x
Thermon Adj. EBITDA (LTM Jun-17) $41 $41
Target Adj. EBITDA (LTM Aug-17)3 – 18
Estimated cost synergies – 2
Adj. EBITDA $41 $61
R 226
G 35
B 26
R 255
G 255
B 255
R 00
G 00
B 00
R 239
G 66
B 67
R 199
G 33
B 39
R 154
G 29
B 32
R 207
G 205
B 206
R 160
G 158
B 159
R 70
G 70
B 71
R 15
G 72
B 120
R 21
G 93
B 160
R 58
G 135
B 193
8
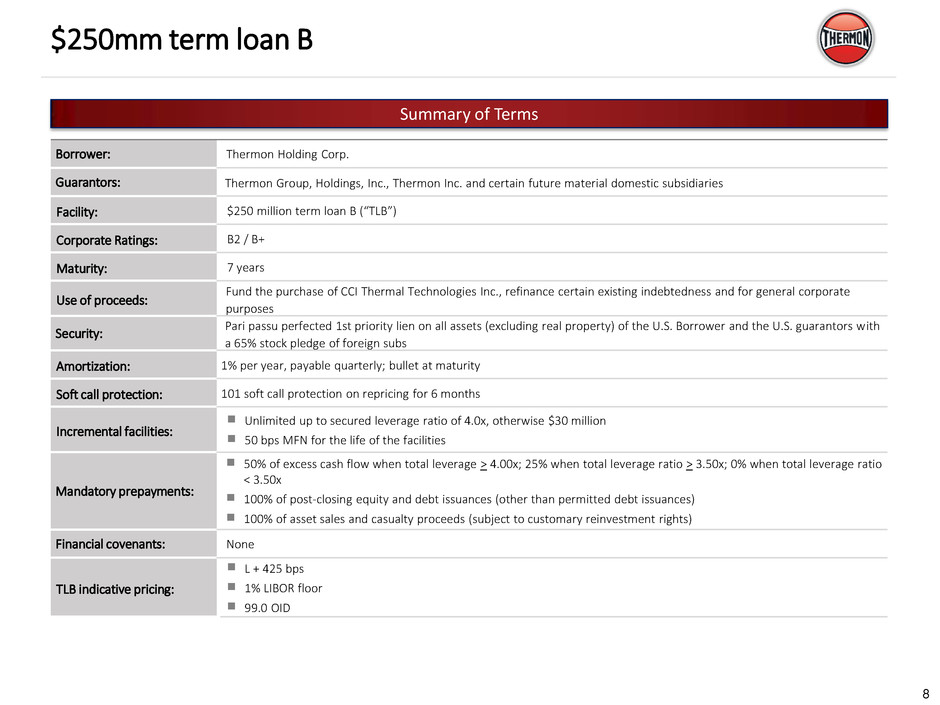
$250mm term loan B
Summary of Terms
Borrower: Thermon Holding Corp.
Guarantors: Thermon Group, Holdings, Inc., Thermon Inc. and certain future material domestic subsidiaries
Facility: $250 million term loan B (“TLB”)
Corporate Ratings: B2 / B+
Maturity: 7 years
Use of proceeds:
Fund the purchase of CCI Thermal Technologies Inc., refinance certain existing indebtedness and for general corporate
purposes
Security:
Pari passu perfected 1st priority lien on all assets (excluding real property) of the U.S. Borrower and the U.S. guarantors with
a 65% stock pledge of foreign subs
Amortization: 1% per year, payable quarterly; bullet at maturity
Soft call protection: 101 soft call protection on repricing for 6 months
Incremental facilities:
Unlimited up to secured leverage ratio of 4.0x, otherwise $30 million
50 bps MFN for the life of the facilities
Mandatory prepayments:
50% of excess cash flow when total leverage > 4.00x; 25% when total leverage ratio > 3.50x; 0% when total leverage ratio
< 3.50x
100% of post-closing equity and debt issuances (other than permitted debt issuances)
100% of asset sales and casualty proceeds (subject to customary reinvestment rights)
Financial covenants: None
TLB indicative pricing:
L + 425 bps
1% LIBOR floor
99.0 OID
R 226
G 35
B 26
R 255
G 255
B 255
R 00
G 00
B 00
R 239
G 66
B 67
R 199
G 33
B 39
R 154
G 29
B 32
R 207
G 205
B 206
R 160
G 158
B 159
R 70
G 70
B 71
R 15
G 72
B 120
R 21
G 93
B 160
R 58
G 135
B 193
9
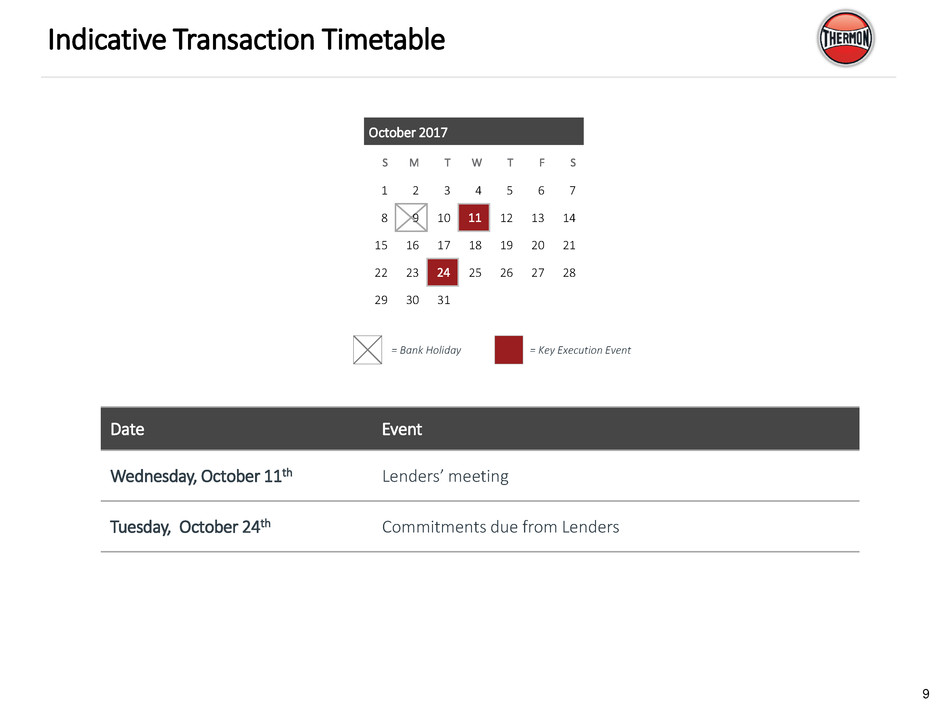
Indicative Transaction Timetable
October 2017
S M T W T F S
1 2 3 4 5 6 7
8 9 10 11 12 13 14
15 16 17 18 19 20 21
22 23 24 25 26 27 28
29 30 31
Date Event
Wednesday, October 11th Lenders’ meeting
Tuesday, October 24th Commitments due from Lenders
= Bank Holiday = Key Execution Event
R 226
G 35
B 26
R 255
G 255
B 255
R 00
G 00
B 00
R 239
G 66
B 67
R 199
G 33
B 39
R 154
G 29
B 32
R 207
G 205
B 206
R 160
G 158
B 159
R 70
G 70
B 71
R 15
G 72
B 120
R 21
G 93
B 160
R 58
G 135
B 193
10
Growth opportunities into new end markets with significant natural gas market exposure
CCI Thermal is predominantly midstream focused in their oil and gas markets, which balances
Thermon’s focus in downstream and upstream
Robust Financial Profile & Performance
Strong normalized adjusted EBITDA margin of 29%; adjusted EBITDA of $24.3 million (avg. ’12-’17)1
Increases scale, size and is accretive to margins, FCF and EPS
Well-Positioned for Future Growth
Buying in a market trough and well positioned for recovery of oil and gas market
CCI Thermal has an $800 million addressable market which is highly fragmented, increasing Thermon’s current $1.5 billion addressable market by
over 50%
Opportunity to push CCI Thermal’s products across Thermon’s sales channels into new geographies
Potential for further end market diversification (semiconductor, pharma, etc.)
Established platform for growth via acquisition with pipeline of actionable M&A opportunities
Deep pipeline of new products (e.g. IoT, methane conversion, Blue Flame Technology)
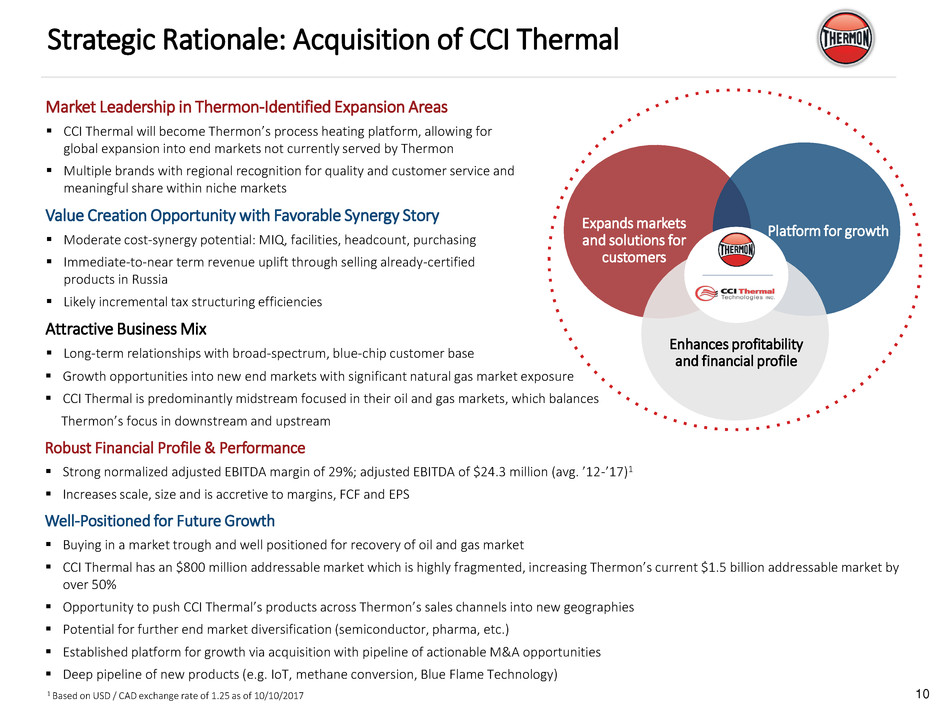
Strategic Rationale: Acquisition of CCI Thermal
Attractive Financial
Profile & Performance
Strong normalized adjusted EBITDA margin of 29%; adjusted EBITDA of $24.3 million (avg. ’12-’17)1
Increases scale, size and is accretive to margins, FCF and EPS
Market Leadership in
Thermon-Identified
Expansion Areas
CCI Thermal will become Thermon’s process heating platform, allowing for global expansion into
end markets not currently served by Thermon
Multiple brands with regional recognition for quality and customer service and meaningful share
within niche markets
Value Creation
Opportunity with
Favorable Synergy Story
Moderate cost-synergy potential: MIQ, facilities, headcount, purchasing
─ Cost synergies reduce purchase price by approximately 1.0x
Immediate-to-near term revenue uplift through selling already-certified products in Russia
Likely incremental tax structuring efficiencies
Attractive Business Mix
Long-term relationships with broad-spectrum, blue-chip customer base
Growth opportunities into new end markets with significant natural gas market exposure
CCI Thermal is predominantly midstream focused in their oil and gas markets, which balances
Thermon’s focus in downstream and upstream
Well-Positioned for
Future Growth
Buying in a market trough and well positioned for recovery of oil and gas market
CCI Thermal has an $800 million addressable market which is highly fragmented, increasing
Thermon’s current $1.5 billion addressable market by over 50%
Opportunity to push CCI Thermal’s products across Thermon’s sales channels into new geographies
Potential for further end market diversification (semiconductor, pharma, etc.)
Established platform for growth via acquisition with pipeline of actionable M&A opportunities
Deep pipeline of new products (e.g. IoT, methane conversion, Blue Flame Technology)
1 Based on USD / CAD exchange rate of 1.25 as of 10/10/2017
Market Leadership in Thermon-Identified Expansion Areas
CCI Thermal will become Thermon’s process heating platform, allowing for
global expansion into end markets not currently served by Thermon
Multiple brands with regional recognition for quality and customer service and
meaningful share within niche markets
Value Creation Opportunity with Favorable Synergy Story
Moderate cost-synergy potential: MIQ, facilities, headcount, purchasing
Immediate-to-near term revenue uplift through selling already-certified
products in Russia
Likely incremental tax structuring efficiencies
Attractive Business Mix
Long-term relationships with broad-spectrum, blue-chip customer base
Platform for growth Expands markets
and solutions for
customers
Enhances profitability
and financial profile
R 226
G 35
B 26
R 255
G 255
B 255
R 00
G 00
B 00
R 239
G 66
B 67
R 199
G 33
B 39
R 154
G 29
B 32
R 207
G 205
B 206
R 160
G 158
B 159
R 70
G 70
B 71
R 15
G 72
B 120
R 21
G 93
B 160
R 58
G 135
B 193
11
Company and Industry Overview
R 226
G 35
B 26
R 255
G 255
B 255
R 00
G 00
B 00
R 239
G 66
B 67
R 199
G 33
B 39
R 154
G 29
B 32
R 207
G 205
B 206
R 160
G 158
B 159
R 70
G 70
B 71
R 15
G 72
B 120
R 21
G 93
B 160
R 58
G 135
B 193
12
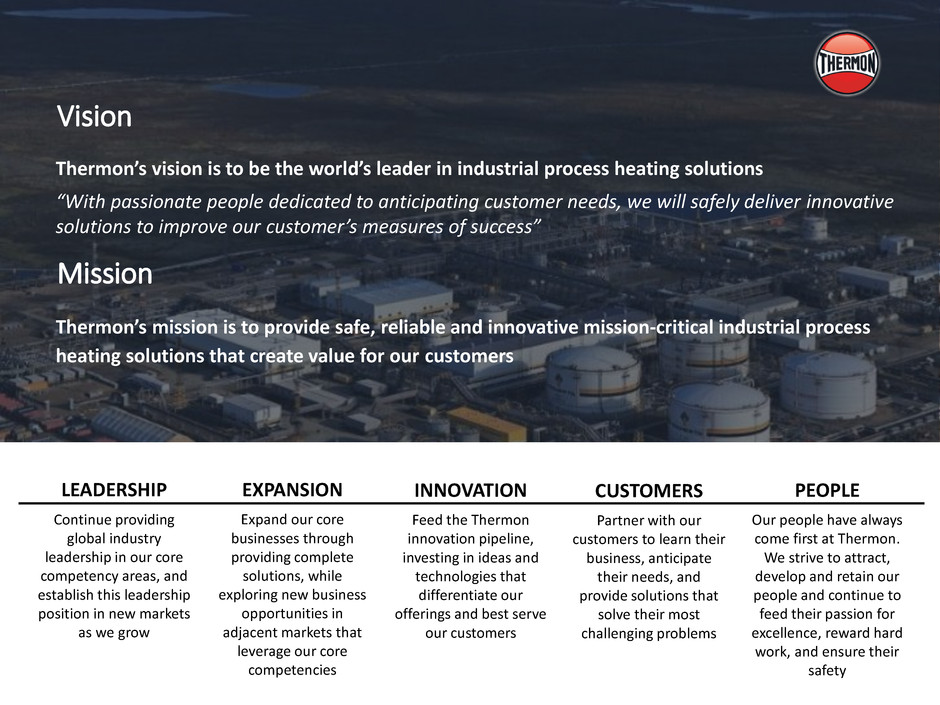
LEADERSHIP
Continue providing
global industry
leadership in our core
competency areas, and
establish this leadership
position in new markets
as we grow
EXPANSION
Expand our core
businesses through
providing complete
solutions, while
exploring new business
opportunities in
adjacent markets that
leverage our core
competencies
INNOVATION
Feed the Thermon
innovation pipeline,
investing in ideas and
technologies that
differentiate our
offerings and best serve
our customers
CUSTOMERS
Partner with our
customers to learn their
business, anticipate
their needs, and
provide solutions that
solve their most
challenging problems
PEOPLE
Our people have always
come first at Thermon.
We strive to attract,
develop and retain our
people and continue to
feed their passion for
excellence, reward hard
work, and ensure their
safety
Thermon’s vision is to be the world’s leader in industrial process heating solutions
“With passionate people dedicated to anticipating customer needs, we will safely deliver innovative
solutions to improve our customer’s measures of success”
Thermon’s mission is to provide safe, reliable and innovative mission-critical industrial process
heating solutions that create value for our customers
Vision
Mission
R 226
G 35
B 26
R 255
G 255
B 255
R 00
G 00
B 00
R 239
G 66
B 67
R 199
G 33
B 39
R 154
G 29
B 32
R 207
G 205
B 206
R 160
G 158
B 159
R 70
G 70
B 71
R 15
G 72
B 120
R 21
G 93
B 160
R 58
G 135
B 193
13
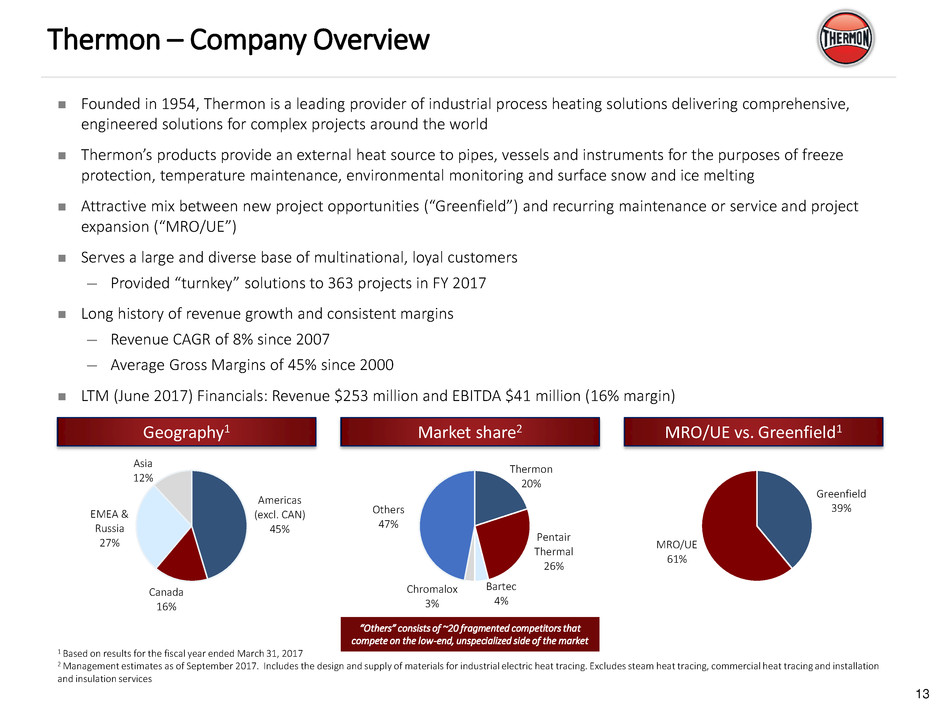
Thermon – Company Overview
Founded in 1954, Thermon is a leading provider of industrial process heating solutions delivering comprehensive,
engineered solutions for complex projects around the world
Thermon’s products provide an external heat source to pipes, vessels and instruments for the purposes of freeze
protection, temperature maintenance, environmental monitoring and surface snow and ice melting
Attractive mix between new project opportunities (“Greenfield”) and recurring maintenance or service and project
expansion (“MRO/UE”)
Serves a large and diverse base of multinational, loyal customers
─ Provided “turnkey” solutions to 363 projects in FY 2017
Long history of revenue growth and consistent margins
─ Revenue CAGR of 8% since 2007
─ Average Gross Margins of 45% since 2000
LTM (June 2017) Financials: Revenue $253 million and EBITDA $41 million (16% margin)
1 Based on results for the fiscal year ended March 31, 2017
2 Management estimates as of September 2017. Includes the design and supply of materials for industrial electric heat tracing. Excludes steam heat tracing, commercial heat tracing and installation
and insulation services
Americas
(excl. CAN)
45%
Canada
16%
EMEA &
Russia
27%
Asia
12%
Thermon
20%
Pentair
Thermal
26%
Bartec
4%
Chromalox
3%
Others
47%
Greenfield
39%
MRO/UE
61%
Geography1 Market share2 MRO/UE vs. Greenfield1
“Others” consists of ~20 fragmented competitors that
compete on the low-end, unspecialized side of the market
R 226
G 35
B 26
R 255
G 255
B 255
R 00
G 00
B 00
R 239
G 66
B 67
R 199
G 33
B 39
R 154
G 29
B 32
R 207
G 205
B 206
R 160
G 158
B 159
R 70
G 70
B 71
R 15
G 72
B 120
R 21
G 93
B 160
R 58
G 135
B 193
14
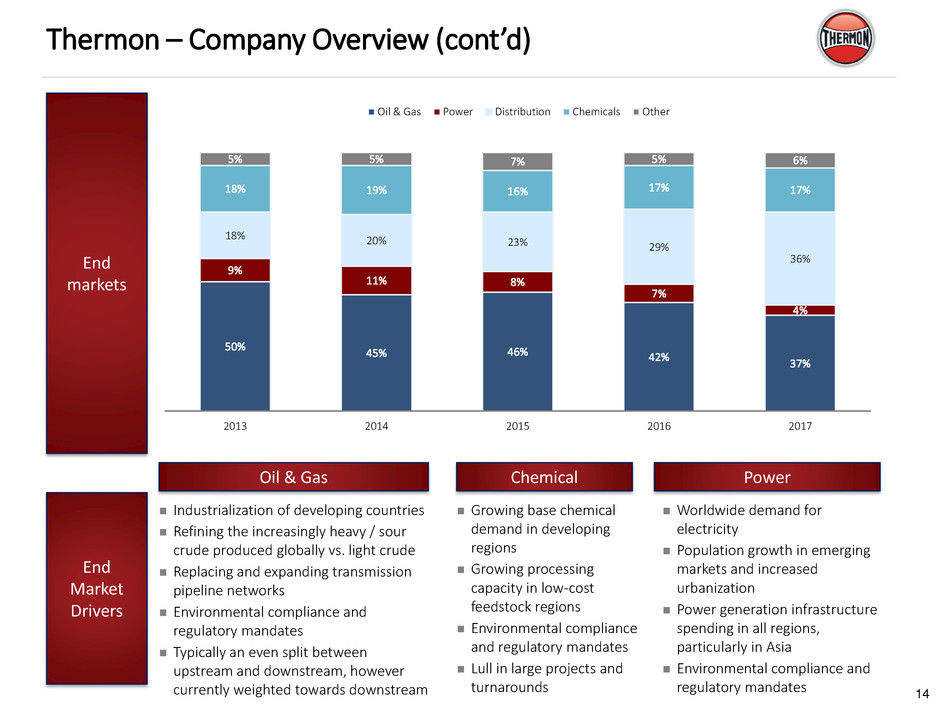
Thermon – Company Overview (cont’d)
Industrialization of developing countries
Refining the increasingly heavy / sour
crude produced globally vs. light crude
Replacing and expanding transmission
pipeline networks
Environmental compliance and
regulatory mandates
Typically an even split between
upstream and downstream, however
currently weighted towards downstream
Growing base chemical
demand in developing
regions
Growing processing
capacity in low-cost
feedstock regions
Environmental compliance
and regulatory mandates
Lull in large projects and
turnarounds
Worldwide demand for
electricity
Population growth in emerging
markets and increased
urbanization
Power generation infrastructure
spending in all regions,
particularly in Asia
Environmental compliance and
regulatory mandates
50%
45% 46% 42%
37%
9%
11% 8%
7%
4%
18% 20% 23% 29%
36%
18% 19% 16% 17% 17%
5% 5% 7% 5% 6%
2013 2014 2015 2016 2017
Oil & Gas Power Distribution Chemicals Other
End
Market
Drivers
End
markets
Oil & Gas Chemical Power

R 226
G 35
B 26
R 255
G 255
B 255
R 00
G 00
B 00
R 239
G 66
B 67
R 199
G 33
B 39
R 154
G 29
B 32
R 207
G 205
B 206
R 160
G 158
B 159
R 70
G 70
B 71
R 15
G 72
B 120
R 21
G 93
B 160
R 58
G 135
B 193
15
Thermon – Company Overview (cont’d)
Customer Overview
Commentary
Thermon serves a large and diverse base of multinational, loyal customers
─ Significant blue chip participation
Thermon has developed tremendous brand equity within the end markets being currently served, and is considered a premium
brand
Longstanding Relationships with Diverse Customers
Thermon’s top 10 customers represented 21% of FY2017
revenues and no single customer represents more than 10% of
the Company’s total revenue
Loyal relationships with customers and strategic partners, some for 60+ years
$ (000’s) FY 2017 Revenue % FY 2017 Relationship
Customer 1 $15,445 6% 30 + Years
Customer 2 7,807 3% 50 + Years
Customer 3 6,599 2% < 10 Years
Customer 4 6,056 2% < 5 Years
Customer 5 5,326 2% 20 + Years
Customer 6 4,163 2% 10 + Years
Customer 7 3,215 1% < 5 Years
Customer 8 3,119 1% < 5 Years
Customer 9 2,952 1% < 5 Years
Customer 10 2,929 1% 20 + Years
Total $57,612 21%
R 226
G 35
B 26
R 255
G 255
B 255
R 00
G 00
B 00
R 239
G 66
B 67
R 199
G 33
B 39
R 154
G 29
B 32
R 207
G 205
B 206
R 160
G 158
B 159
R 70
G 70
B 71
R 15
G 72
B 120
R 21
G 93
B 160
R 58
G 135
B 193
16
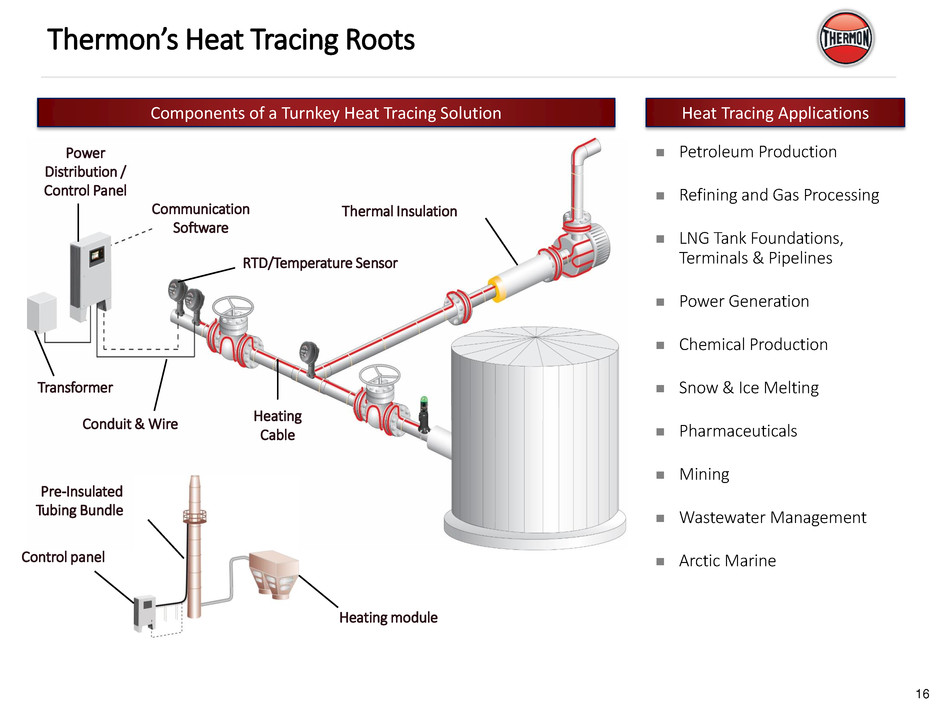
Thermon’s Heat Tracing Roots
Components of a Turnkey Heat Tracing Solution Heat Tracing Applications
Petroleum Production
Refining and Gas Processing
LNG Tank Foundations,
Terminals & Pipelines
Power Generation
Chemical Production
Snow & Ice Melting
Pharmaceuticals
Mining
Wastewater Management
Arctic Marine
Transformer
Power
Distribution /
Control Panel
Conduit & Wire Heating
Cable
RTD/Temperature Sensor
Thermal Insulation Communication
Software
Pre-Insulated
Tubing Bundle
Heating module
Control panel
R 226
G 35
B 26
R 255
G 255
B 255
R 00
G 00
B 00
R 239
G 66
B 67
R 199
G 33
B 39
R 154
G 29
B 32
R 207
G 205
B 206
R 160
G 158
B 159
R 70
G 70
B 71
R 15
G 72
B 120
R 21
G 93
B 160
R 58
G 135
B 193
17
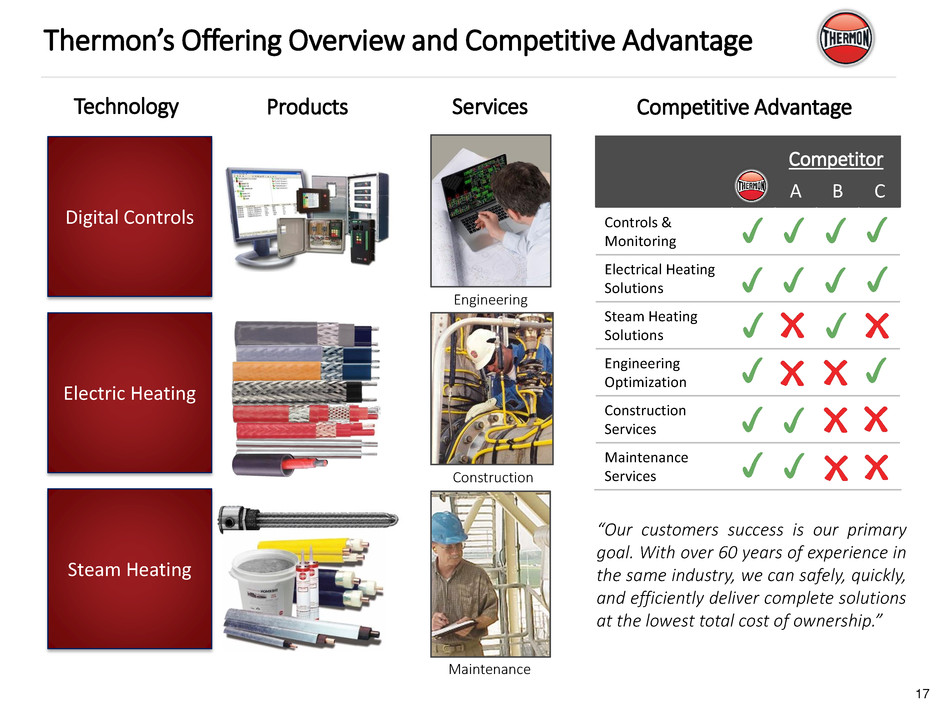
Thermon’s Offering Overview and Competitive Advantage
Products
Digital Controls
Electric Heating
Technology
Steam Heating
Services
Engineering
Construction
Maintenance
Competitive Advantage
A B C
Controls &
Monitoring
Electrical Heating
Solutions
Steam Heating
Solutions
Engineering
Optimization
Construction
Services
Maintenance
Services
“Our customers success is our primary
goal. With over 60 years of experience in
the same industry, we can safely, quickly,
and efficiently deliver complete solutions
at the lowest total cost of ownership.”
Longstanding Relationships with Diverse Customers
($ 000’s) FY 2017 Revenue % FY 2017 Relationship
Customer 1 $15,445 6% 30 + Years
Customer 2 7,807 3% 50 + Years
Customer 3 6,599 2% < 10 Years
Customer 4 6,056 2% < 5 Years
Customer 5 5,326 2% 20 + Years
Customer 6 4,163 2% 10 + Years
Customer 7 3,215 1% < 5 Years
Customer 8 3,119 1% < 5 Years
Customer 9 2,952 1% < 5 Years
Customer 10 2,929 1% 20 + Years
Total $57,612 21%
Competitor
R 226
G 35
B 26
R 255
G 255
B 255
R 00
G 00
B 00
R 239
G 66
B 67
R 199
G 33
B 39
R 154
G 29
B 32
R 207
G 205
B 206
R 160
G 158
B 159
R 70
G 70
B 71
R 15
G 72
B 120
R 21
G 93
B 160
R 58
G 135
B 193
18
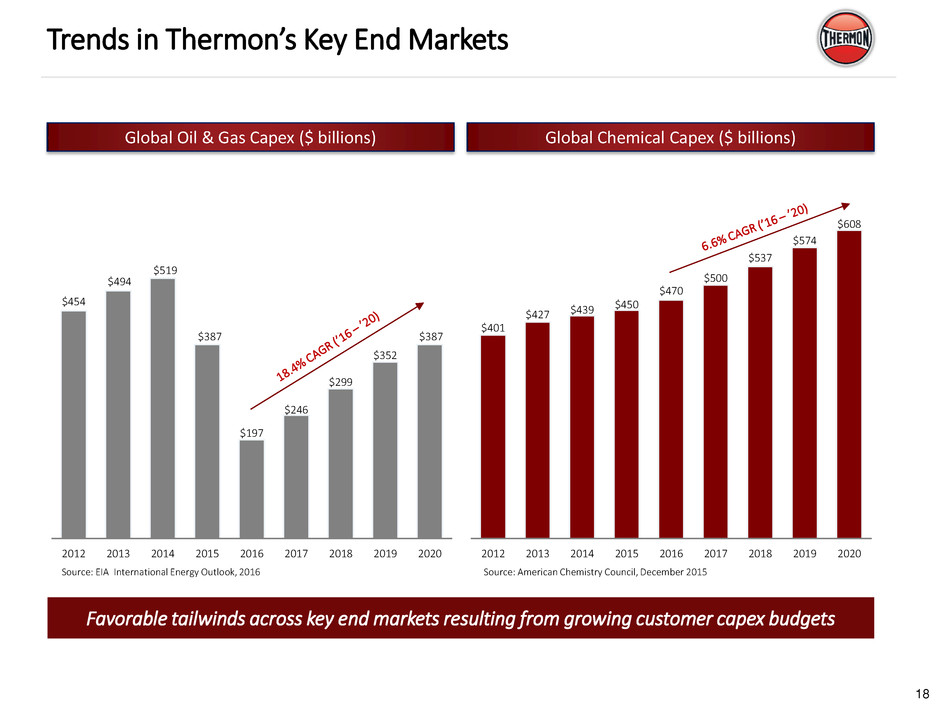
Trends in Thermon’s Key End Markets
Global Chemical Capex ($ billions) Global Oil & Gas Capex ($ billions)
$401
$427 $439
$450
$470
$500
$537
$574
$608
2012 2013 2014 2015 2016 2017 2018 2019 2020
$454
$494
$519
$387
$197
$246
$299
$352
$387
2012 2013 2014 2015 2016 2017 2018 2019 2020
Source: American Chemistry Council, December 2015 Source: EIA International Energy Outlook, 2016
Favorable tailwinds across key end markets resulting from growing customer capex budgets
R 226
G 35
B 26
R 255
G 255
B 255
R 00
G 00
B 00
R 239
G 66
B 67
R 199
G 33
B 39
R 154
G 29
B 32
R 207
G 205
B 206
R 160
G 158
B 159
R 70
G 70
B 71
R 15
G 72
B 120
R 21
G 93
B 160
R 58
G 135
B 193
19
R 226
G 35
B 26
R 255
G 255
B 255
R 00
G 00
B 00
R 239
G 66
B 67
R 199
G 33
B 39
R 154
G 29
B 32
R 207
G 205
B 206
R 160
G 158
B 159
R 70
G 70
B 71
R 15
G 72
B 120
R 21
G 93
B 160
R 58
G 135
B 193
20
R 226
G 35
B 26
R 255
G 255
B 255
R 00
G 00
B 00
R 239
G 66
B 67
R 199
G 33
B 39
R 154
G 29
B 32
R 207
G 205
B 206
R 160
G 158
B 159
R 70
G 70
B 71
R 15
G 72
B 120
R 21
G 93
B 160
R 58
G 135
B 193
21
R 226
G 35
B 26
R 255
G 255
B 255
R 00
G 00
B 00
R 239
G 66
B 67
R 199
G 33
B 39
R 154
G 29
B 32
R 207
G 205
B 206
R 160
G 158
B 159
R 70
G 70
B 71
R 15
G 72
B 120
R 21
G 93
B 160
R 58
G 135
B 193
22
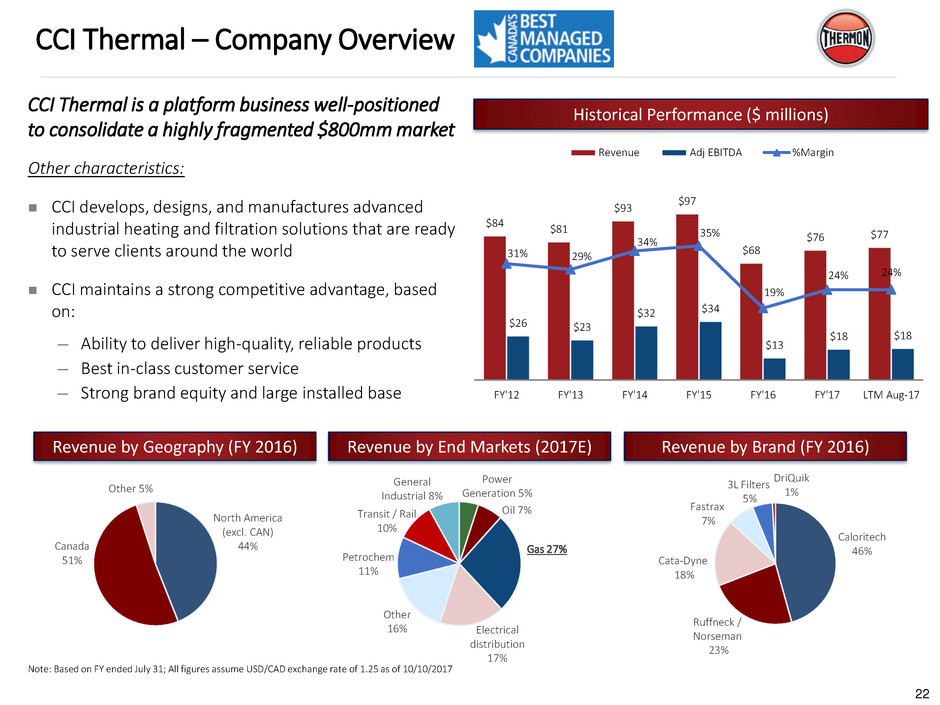
CCI Thermal – Company Overview
CCI Thermal is a platform business well-positioned
to consolidate a highly fragmented $800mm market
Other characteristics:
CCI develops, designs, and manufactures advanced
industrial heating and filtration solutions that are ready
to serve clients around the world
CCI maintains a strong competitive advantage, based
on:
─ Ability to deliver high-quality, reliable products
─ Best in-class customer service
─ Strong brand equity and large installed base
Revenue by Geography (FY 2016) Revenue by End Markets (2017E) Revenue by Brand (FY 2016)
$84
$81
$93
$97
$68
$76 $77
$26 $23
$32 $34
$13
$18 $18
31% 29%
34%
35%
19%
24% 24%
FY'12 FY'13 FY'14 FY'15 FY'16 FY'17 LTM Aug-17
Revenue Adj EBITDA %Margin
Historical Performance ($ millions)
3L Filters
5%
Ruffneck /
Norseman
23%
Fastrax
7%
Cata-Dyne
18%
Caloritech
46%
DriQuik
1%
North America
(excl. CAN)
44% Canada
51%
Other 5%
Note: Based on FY ended July 31; All figures assume USD/CAD exchange rate of 1.25 as of 10/10/2017
Gas 27%
Electrical
distribution
17%
Transit / Rail
10%
Power
Generation 5%
Other
16%
General
Industrial 8%
Petrochem
11%
Oil 7%
R 226
G 35
B 26
R 255
G 255
B 255
R 00
G 00
B 00
R 239
G 66
B 67
R 199
G 33
B 39
R 154
G 29
B 32
R 207
G 205
B 206
R 160
G 158
B 159
R 70
G 70
B 71
R 15
G 72
B 120
R 21
G 93
B 160
R 58
G 135
B 193
23
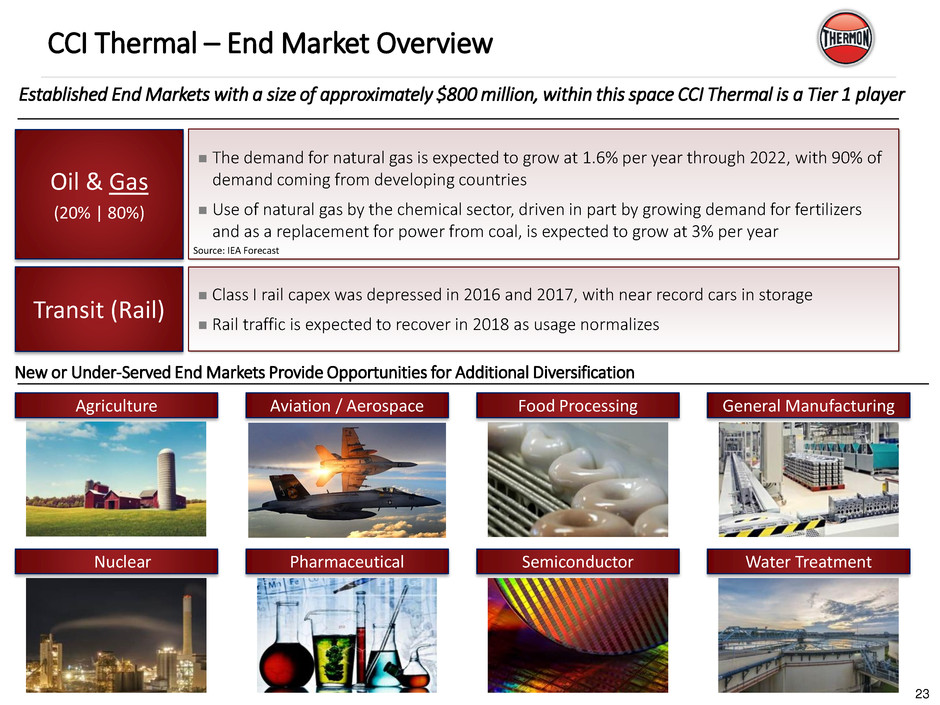
CCI Thermal – End Market Overview
The demand for natural gas is expected to grow at 1.6% per year through 2022, with 90% of
demand coming from developing countries
Use of natural gas by the chemical sector, driven in part by growing demand for fertilizers
and as a replacement for power from coal, is expected to grow at 3% per year
Class I rail capex was depressed in 2016 and 2017, with near record cars in storage
Rail traffic is expected to recover in 2018 as usage normalizes
Established End Markets with a size of approximately $800 million, within this space CCI Thermal is a Tier 1 player
New or Under-Served End Markets Provide Opportunities for Additional Diversification
Agriculture
Oil & Gas
(20% | 80%)
Transit (Rail)
Aviation / Aerospace Food Processing General Manufacturing
Nuclear Pharmaceutical Semiconductor Water Treatment
Source: IEA Forecast
R 226
G 35
B 26
R 255
G 255
B 255
R 00
G 00
B 00
R 239
G 66
B 67
R 199
G 33
B 39
R 154
G 29
B 32
R 207
G 205
B 206
R 160
G 158
B 159
R 70
G 70
B 71
R 15
G 72
B 120
R 21
G 93
B 160
R 58
G 135
B 193
24
0
1,000
2,000
3,000
4,000
5,000
2000 2002 2004 2006 2008 2010 2012 2014 2016 2018 2020 2022
Rest of the world United States European Union
Russia Federation Middle East China
South East Asia India
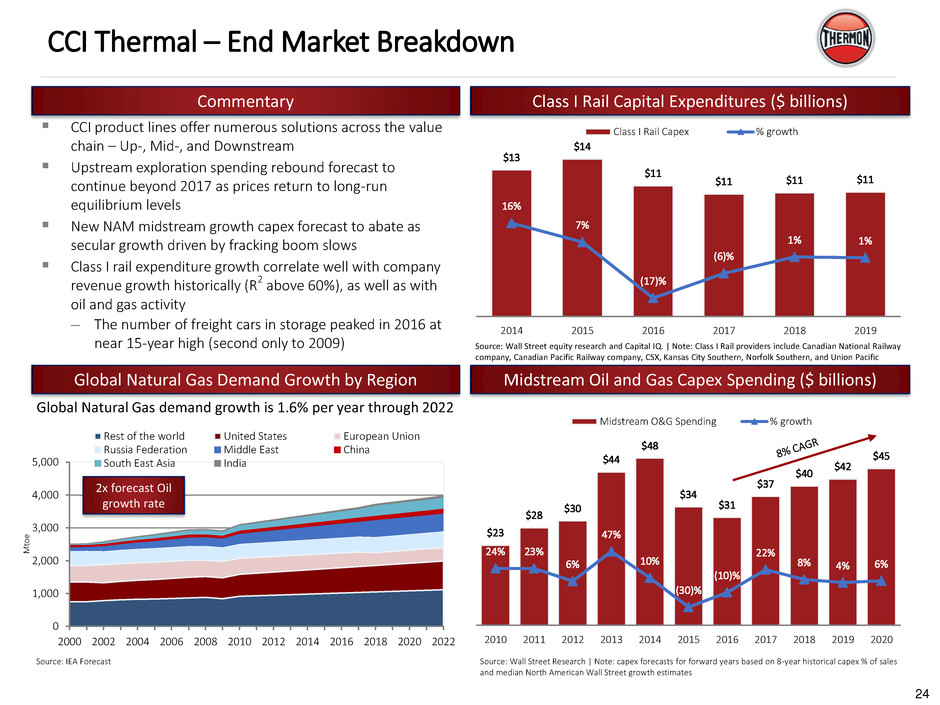
CCI Thermal – End Market Breakdown
$23
$28
$30
$44
$48
$34
$31
$37
$40 $42
$45
23.5%23.4%
6.0% 46.9%
10.4%
(29.8%)
(9.7%)
21.9%
8.3% 4.0%6.3%
-100%
-80%
-60%
-40%
-20%
0%
20%
40%
60%
80%
100%
$0
$10
$20
$30
$40
$50
$60
2010 2011 2012 2013 2014 2015 2016 2017 2018 2019 2020
Midstream Spend Growth
Global Natural Gas Demand Growth by Region Midstream Oil and Gas Capex Spending ($ billions)
Source: IEA Forecast Source: Wall Street Research | Note: capex forecasts for forward years based on 8-year historical capex % of sales
and median North American Wall Street growth estimates
Class I Rail Capital Expenditures ($ billions) Commentary
CCI product lines offer numerous solutions across the value
chain – Up-, Mid-, and Downstream
Upstream exploration spending rebound forecast to
continue beyond 2017 as prices return to long-run
equilibrium levels
New NAM midstream growth capex forecast to abate as
secular growth driven by fracking boom slows
Class I rail expenditure growth correlate well with company
revenue growth historically (R2 above 60%), as well as with
oil and gas activity
─ The number of freight cars in storage peaked in 2016 at
near 15-year high (second only to 2009)
Global Natural Gas demand growth is 1.6% per year through 2022
$12,781
$13,728
$11,399
$10,689 $10,790 $10,854
15.7%
7.4%
(17.0%)
(6.2%)
0.9% 0.6%
(20.0%)
(15.0%)
(10.0%)
(5.0%)
0.0%
5.0%
10.0%
15.0%
20.0%
CY2014 CY2015 CY2016 CY2017 CY2018 CY2019
$0
$2,000
$4,000
$6,000
$8,000
$10,000
$12,000
$14,000
$16,000
Class I Rail CapEx Growth
$13
$14
$11
$11 $11 $11
16%
7%
(17)%
(6)%
1% 1%
2014 2015 2016 2017 2018 2019
Class I Rail Capex % growth
$23
$28
$30
$44
$48
$34
$31
$37
$40
$42
$45
24% 23%
6%
47%
10%
(30)%
(10)%
22%
8% 4% 6%
2010 2011 2012 2013 2014 2015 2016 2017 2018 2019 2020
Midstream O&G Spending % growth
2x forecast Oil
growth rate
Source: Wall Street equity research and Capital IQ. | Note: Class I Rail providers include Canadian National Railway
company, Canadian Pacific Railway company, CSX, Kansas City Southern, Norfolk Southern, and Union Pacific
Mt
o
e
R 226
G 35
B 26
R 255
G 255
B 255
R 00
G 00
B 00
R 239
G 66
B 67
R 199
G 33
B 39
R 154
G 29
B 32
R 207
G 205
B 206
R 160
G 158
B 159
R 70
G 70
B 71
R 15
G 72
B 120
R 21
G 93
B 160
R 58
G 135
B 193
25
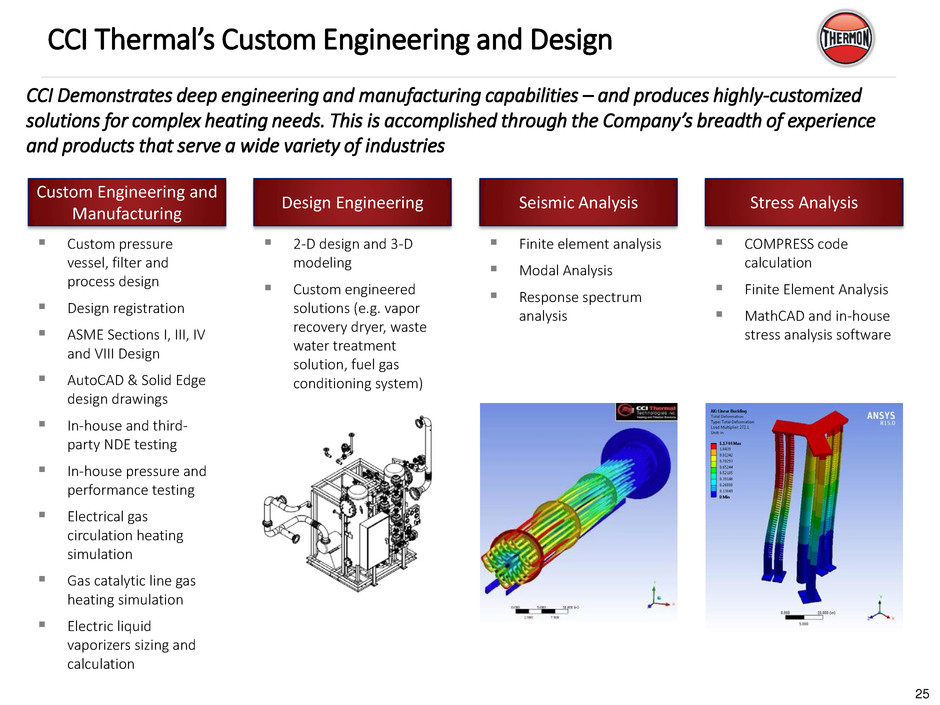
CCI Thermal’s Custom Engineering and Design
CCI Demonstrates deep engineering and manufacturing capabilities – and produces highly-customized
solutions for complex heating needs. This is accomplished through the Company’s breadth of experience
and products that serve a wide variety of industries
Custom pressure
vessel, filter and
process design
Design registration
ASME Sections I, III, IV
and VIII Design
AutoCAD & Solid Edge
design drawings
In-house and third-
party NDE testing
In-house pressure and
performance testing
Electrical gas
circulation heating
simulation
Gas catalytic line gas
heating simulation
Electric liquid
vaporizers sizing and
calculation
Custom Engineering and
Manufacturing
2-D design and 3-D
modeling
Custom engineered
solutions (e.g. vapor
recovery dryer, waste
water treatment
solution, fuel gas
conditioning system)
Design Engineering
Finite element analysis
Modal Analysis
Response spectrum
analysis
Seismic Analysis
COMPRESS code
calculation
Finite Element Analysis
MathCAD and in-house
stress analysis software
Stress Analysis
R 226
G 35
B 26
R 255
G 255
B 255
R 00
G 00
B 00
R 239
G 66
B 67
R 199
G 33
B 39
R 154
G 29
B 32
R 207
G 205
B 206
R 160
G 158
B 159
R 70
G 70
B 71
R 15
G 72
B 120
R 21
G 93
B 160
R 58
G 135
B 193
26
CCI Thermal – Operations
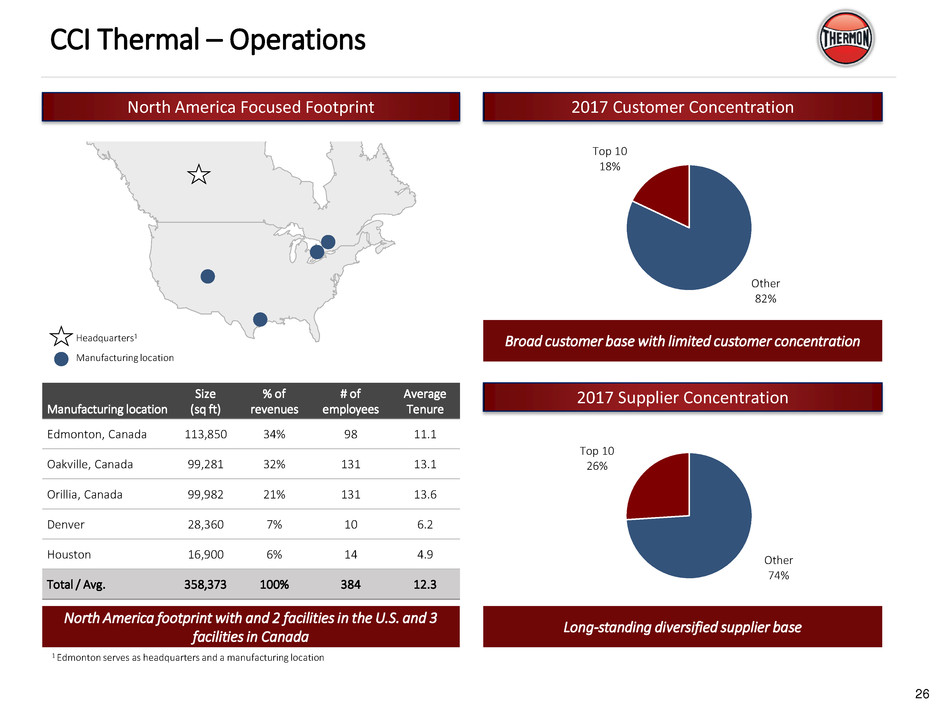
2017 Supplier Concentration
2017 Customer Concentration North America Focused Footprint
Broad customer base with limited customer concentration
Manufacturing location
Size
(sq ft)
% of
revenues
# of
employees
Average
Tenure
Edmonton, Canada 113,850 34% 98 11.1
Oakville, Canada 99,281 32% 131 13.1
Orillia, Canada 99,982 21% 131 13.6
Denver 28,360 7% 10 6.2
Houston 16,900 6% 14 4.9
Total / Avg. 358,373 100% 384 12.3
North America footprint with and 2 facilities in the U.S. and 3
facilities in Canada
Long-standing diversified supplier base
1 Edmonton serves as headquarters and a manufacturing location
Headquarters1
Manufacturing location
Other
82%
Top 10
18%
Other
74%
Top 10
26%
R 226
G 35
B 26
R 255
G 255
B 255
R 00
G 00
B 00
R 239
G 66
B 67
R 199
G 33
B 39
R 154
G 29
B 32
R 207
G 205
B 206
R 160
G 158
B 159
R 70
G 70
B 71
R 15
G 72
B 120
R 21
G 93
B 160
R 58
G 135
B 193
27
CCI Thermal’s Capabilities Complement Thermon’s
Process Heating Portfolio
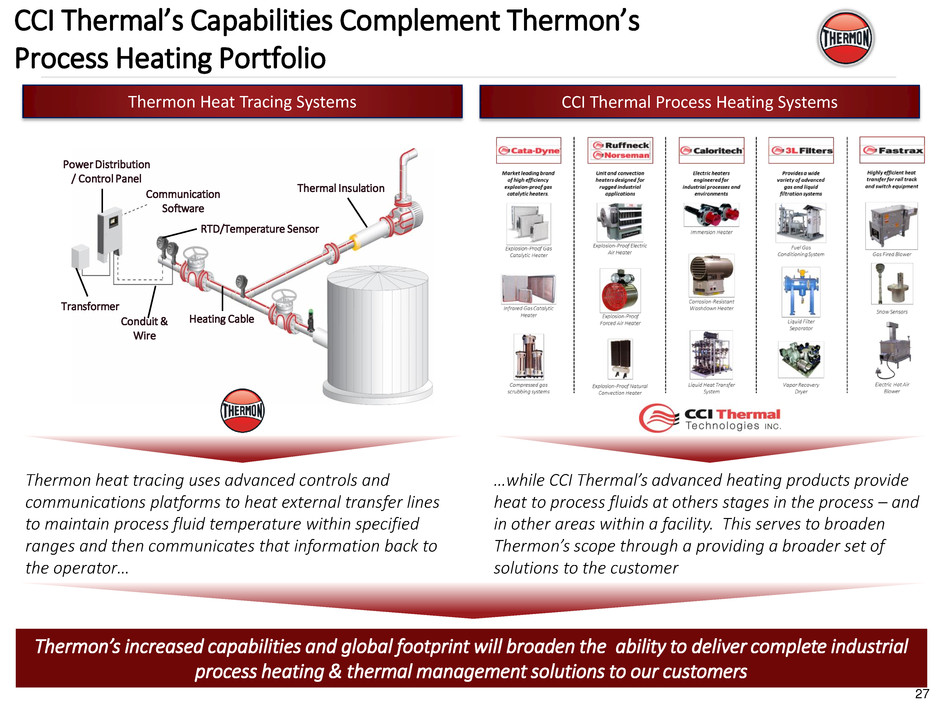
Thermon’s increased capabilities and global footprint will broaden the ability to deliver complete industrial
process heating & thermal management solutions to our customers
Transformer
Power Distribution
/ Control Panel
Conduit &
Wire
Heating Cable
RTD/Temperature Sensor
Thermal Insulation
Communication
Software
Thermon Heat Tracing Systems CCI Thermal Process Heating Systems
Thermon heat tracing uses advanced controls and
communications platforms to heat external transfer lines
to maintain process fluid temperature within specified
ranges and then communicates that information back to
the operator…
…while CCI Thermal’s advanced heating products provide
heat to process fluids at others stages in the process – and
in other areas within a facility. This serves to broaden
Thermon’s scope through a providing a broader set of
solutions to the customer
R 226
G 35
B 26
R 255
G 255
B 255
R 00
G 00
B 00
R 239
G 66
B 67
R 199
G 33
B 39
R 154
G 29
B 32
R 207
G 205
B 206
R 160
G 158
B 159
R 70
G 70
B 71
R 15
G 72
B 120
R 21
G 93
B 160
R 58
G 135
B 193
28
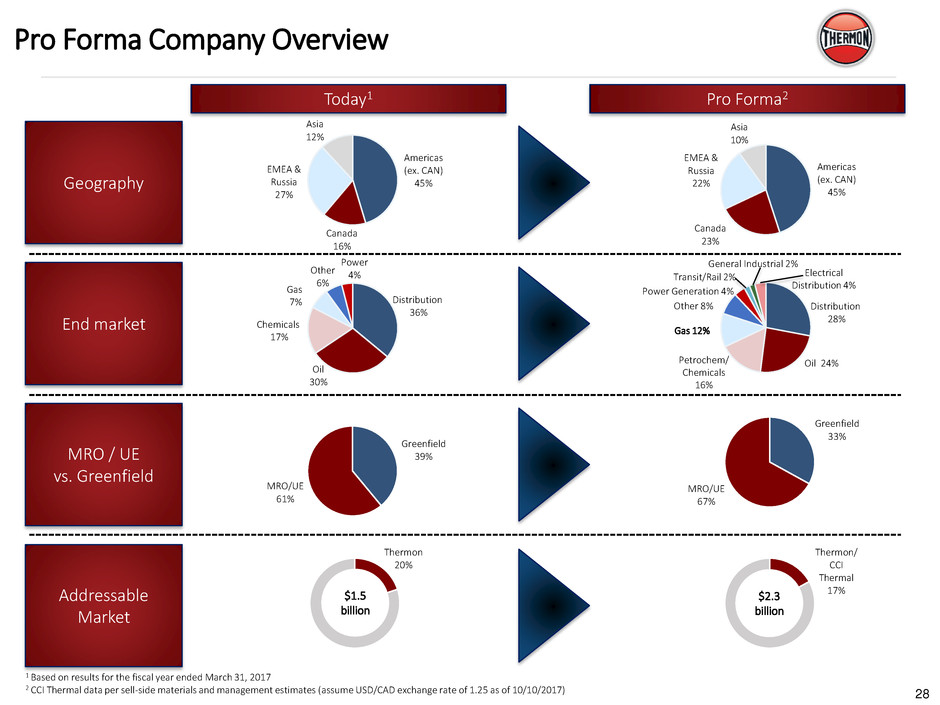
End market
MRO / UE
vs. Greenfield
Pro Forma Company Overview
Americas
(ex. CAN)
45%
Canada
16%
EMEA &
Russia
27%
Asia
12%
Greenfield
39%
MRO/UE
61%
Oil
30%
Other
6%
Power
4%
Americas
(ex. CAN)
45%
Canada
23%
EMEA &
Russia
22%
Asia
10%
Oil 24%
Gas 12%
Other 8%
1 Based on results for the fiscal year ended March 31, 2017
2 CCI Thermal data per sell-side materials and management estimates (assume USD/CAD exchange rate of 1.25 as of 10/10/2017)
Today1 Pro Forma2
Geography
Addressable
Market
Greenfield
33%
MRO/UE
67%
Distribution
36%
Petrochem/
Chemicals
16%
Distribution
28%
General Industrial 2%
Transit/Rail 2%
Power Generation 4%
Electrical
Distribution 4%
Chemicals
17%
Gas
7%
Thermon
20%
Thermon/
CCI
Thermal
17% $1.5
billion
$2.3
billion
R 226
G 35
B 26
R 255
G 255
B 255
R 00
G 00
B 00
R 239
G 66
B 67
R 199
G 33
B 39
R 154
G 29
B 32
R 207
G 205
B 206
R 160
G 158
B 159
R 70
G 70
B 71
R 15
G 72
B 120
R 21
G 93
B 160
R 58
G 135
B 193
29
Key Credit Highlights
R 226
G 35
B 26
R 255
G 255
B 255
R 00
G 00
B 00
R 239
G 66
B 67
R 199
G 33
B 39
R 154
G 29
B 32
R 207
G 205
B 206
R 160
G 158
B 159
R 70
G 70
B 71
R 15
G 72
B 120
R 21
G 93
B 160
R 58
G 135
B 193
30
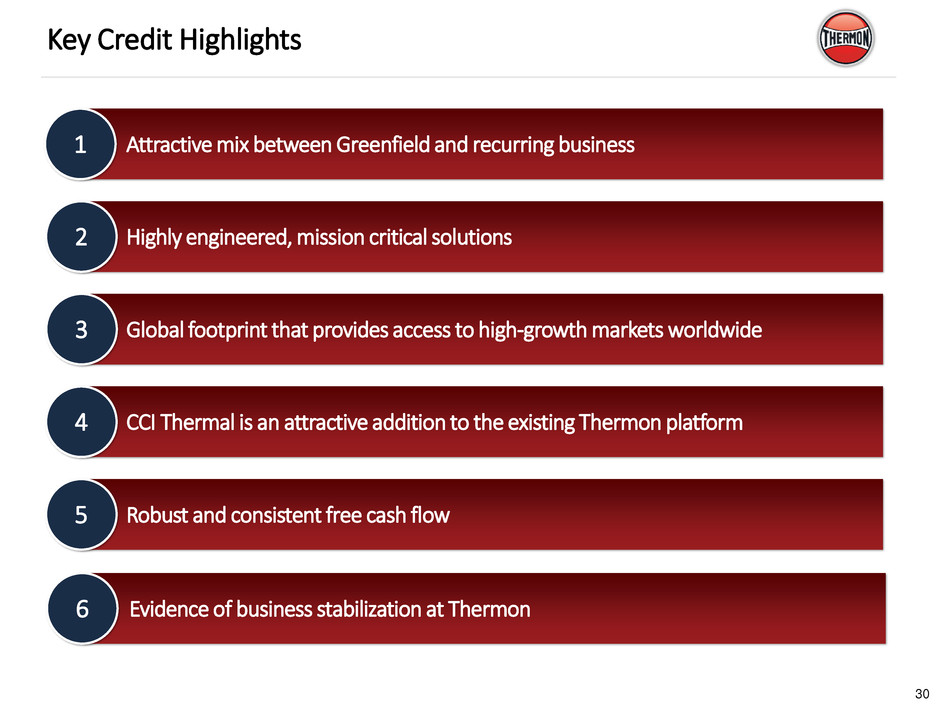
Key Credit Highlights
CCI Thermal is an attractive addition to the existing Thermon platform
Attractive mix between Greenfield and recurring business
Highly engineered, mission critical solutions
Global footprint that provides access to high-growth markets worldwide
Robust and consistent free cash flow
1
2
3
4
5
Evidence of business stabilization at Thermon 6
R 226
G 35
B 26
R 255
G 255
B 255
R 00
G 00
B 00
R 239
G 66
B 67
R 199
G 33
B 39
R 154
G 29
B 32
R 207
G 205
B 206
R 160
G 158
B 159
R 70
G 70
B 71
R 15
G 72
B 120
R 21
G 93
B 160
R 58
G 135
B 193
31
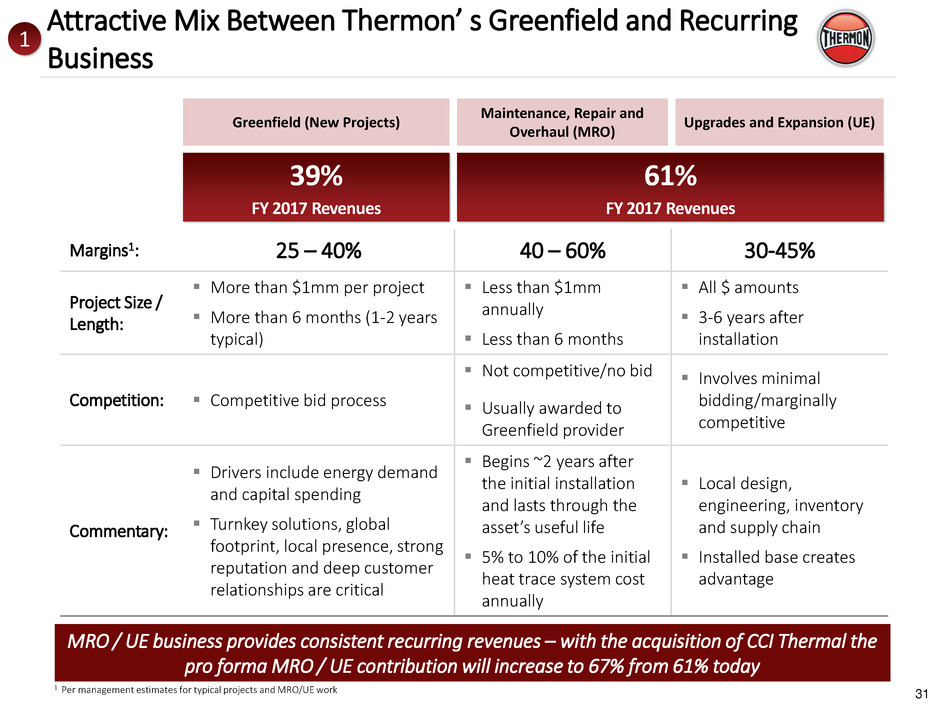
Margins1: 25 – 40% 40 – 60% 30-45%
Project Size /
Length:
More than $1mm per project
More than 6 months (1-2 years
typical)
Less than $1mm
annually
Less than 6 months
All $ amounts
3-6 years after
installation
Competition: Competitive bid process
Not competitive/no bid
Usually awarded to
Greenfield provider
Involves minimal
bidding/marginally
competitive
Commentary:
Drivers include energy demand
and capital spending
Turnkey solutions, global
footprint, local presence, strong
reputation and deep customer
relationships are critical
Begins ~2 years after
the initial installation
and lasts through the
asset’s useful life
5% to 10% of the initial
heat trace system cost
annually
Local design,
engineering, inventory
and supply chain
Installed base creates
advantage
Greenfield (New Projects)
Maintenance, Repair and
Overhaul (MRO)
Upgrades and Expansion (UE)
MRO / UE business provides consistent recurring revenues – with the acquisition of CCI Thermal the
pro forma MRO / UE contribution will increase to 67% from 61% today
39%
FY 2017 Revenues
61%
FY 2017 Revenues
1
Attractive Mix Between Thermon’ s Greenfield and Recurring
Business
1 Per management estimates for typical projects and MRO/UE work
R 226
G 35
B 26
R 255
G 255
B 255
R 00
G 00
B 00
R 239
G 66
B 67
R 199
G 33
B 39
R 154
G 29
B 32
R 207
G 205
B 206
R 160
G 158
B 159
R 70
G 70
B 71
R 15
G 72
B 120
R 21
G 93
B 160
R 58
G 135
B 193
32
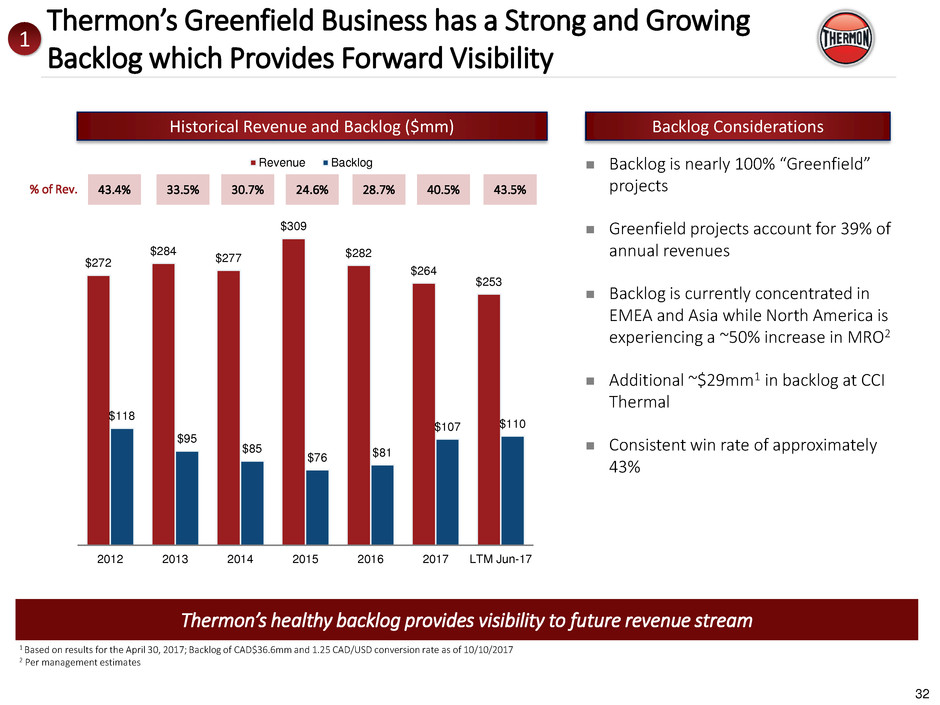
$272
$284
$277
$309
$282
$264
$253
$118
$95
$85
$76 $81
$107 $110
2012 2013 2014 2015 2016 2017 LTM Jun-17
Revenue Backlog
43.4% 33.5% 30.7% 24.6% 28.7% 40.5% 43.5% % of Rev.
Backlog is nearly 100% “Greenfield”
projects
Greenfield projects account for 39% of
annual revenues
Backlog is currently concentrated in
EMEA and Asia while North America is
experiencing a ~50% increase in MRO2
Additional ~$29mm1 in backlog at CCI
Thermal
Consistent win rate of approximately
43%
1 Based on results for the April 30, 2017; Backlog of CAD$36.6mm and 1.25 CAD/USD conversion rate as of 10/10/2017
2 Per management estimates
Thermon’s healthy backlog provides visibility to future revenue stream
Historical Revenue and Backlog ($mm) Backlog Considerations
1
Thermon’s Greenfield Business has a Strong and Growing
Backlog which Provides Forward Visibility
R 226
G 35
B 26
R 255
G 255
B 255
R 00
G 00
B 00
R 239
G 66
B 67
R 199
G 33
B 39
R 154
G 29
B 32
R 207
G 205
B 206
R 160
G 158
B 159
R 70
G 70
B 71
R 15
G 72
B 120
R 21
G 93
B 160
R 58
G 135
B 193
33
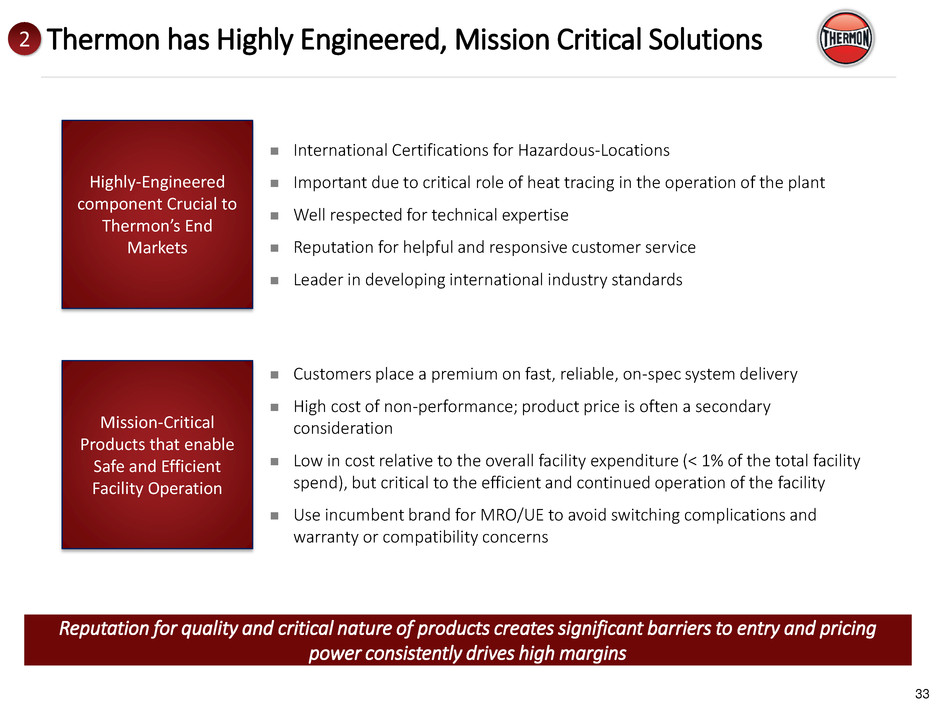
Reputation for quality and critical nature of products creates significant barriers to entry and pricing
power consistently drives high margins
International Certifications for Hazardous-Locations
Important due to critical role of heat tracing in the operation of the plant
Well respected for technical expertise
Reputation for helpful and responsive customer service
Leader in developing international industry standards
Customers place a premium on fast, reliable, on-spec system delivery
High cost of non-performance; product price is often a secondary
consideration
Low in cost relative to the overall facility expenditure (< 1% of the total facility
spend), but critical to the efficient and continued operation of the facility
Use incumbent brand for MRO/UE to avoid switching complications and
warranty or compatibility concerns
Highly-Engineered
component Crucial to
Thermon’s End
Markets
Mission-Critical
Products that enable
Safe and Efficient
Facility Operation
2 Thermon has Highly Engineered, Mission Critical Solutions
R 226
G 35
B 26
R 255
G 255
B 255
R 00
G 00
B 00
R 239
G 66
B 67
R 199
G 33
B 39
R 154
G 29
B 32
R 207
G 205
B 206
R 160
G 158
B 159
R 70
G 70
B 71
R 15
G 72
B 120
R 21
G 93
B 160
R 58
G 135
B 193
34
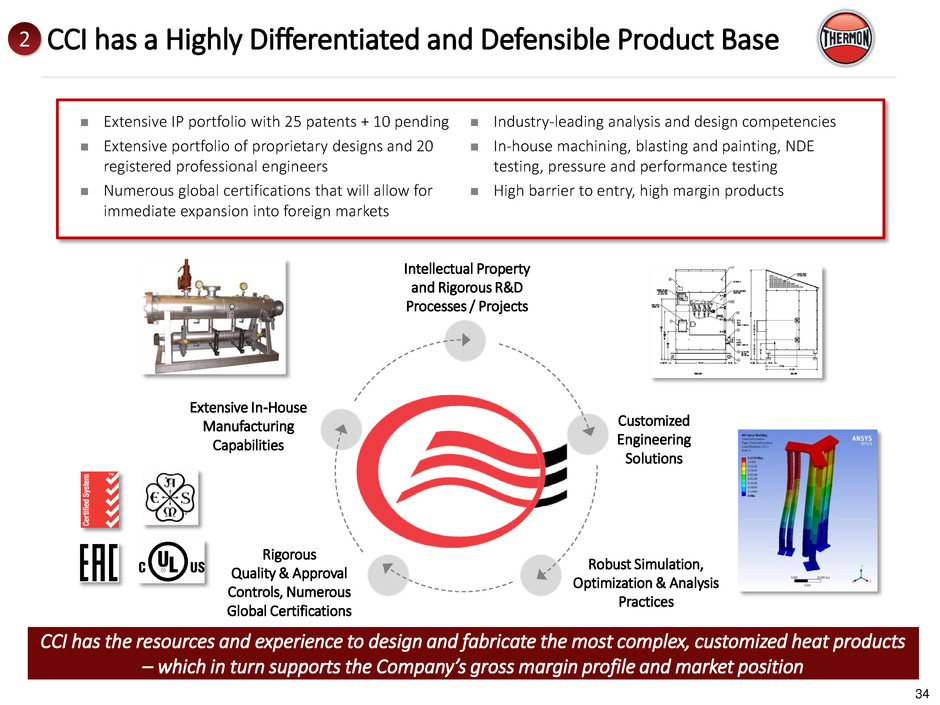
Extensive IP portfolio with 25 patents + 10 pending
Extensive portfolio of proprietary designs and 20
registered professional engineers
Numerous global certifications that will allow for
immediate expansion into foreign markets
Industry-leading analysis and design competencies
In-house machining, blasting and painting, NDE
testing, pressure and performance testing
High barrier to entry, high margin products
Customized
Engineering
Solutions
Intellectual Property
and Rigorous R&D
Processes / Projects
Rigorous
Quality & Approval
Controls, Numerous
Global Certifications
Robust Simulation,
Optimization & Analysis
Practices
Extensive In-House
Manufacturing
Capabilities
CCI has the resources and experience to design and fabricate the most complex, customized heat products
– which in turn supports the Company’s gross margin profile and market position
2 CCI has a Highly Differentiated and Defensible Product Base
R 226
G 35
B 26
R 255
G 255
B 255
R 00
G 00
B 00
R 239
G 66
B 67
R 199
G 33
B 39
R 154
G 29
B 32
R 207
G 205
B 206
R 160
G 158
B 159
R 70
G 70
B 71
R 15
G 72
B 120
R 21
G 93
B 160
R 58
G 135
B 193
35
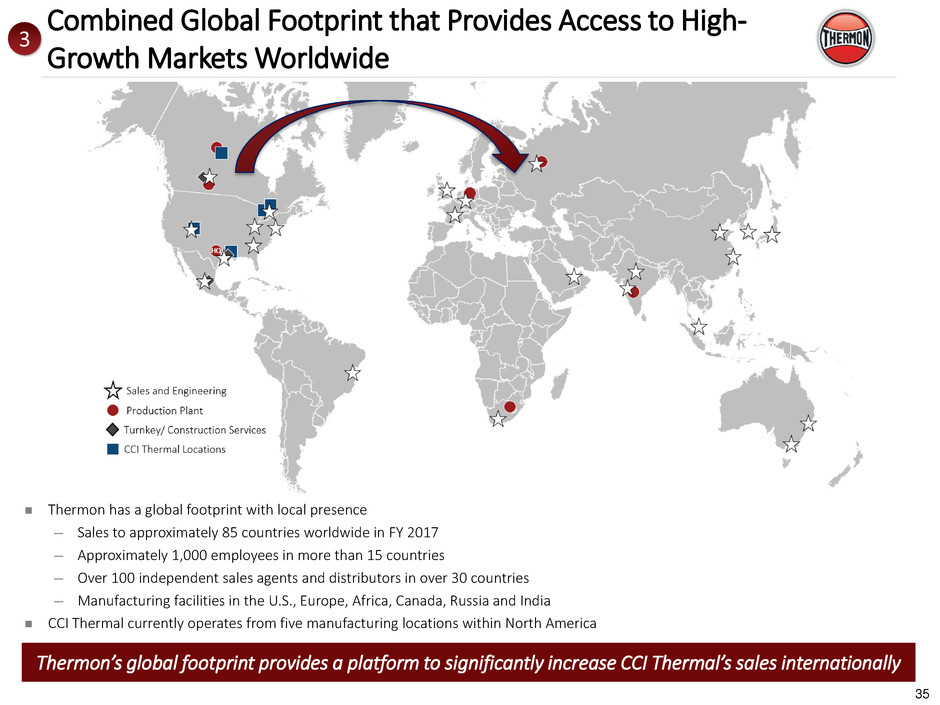
Thermon has a global footprint with local presence
─ Sales to approximately 85 countries worldwide in FY 2017
─ Approximately 1,000 employees in more than 15 countries
─ Over 100 independent sales agents and distributors in over 30 countries
─ Manufacturing facilities in the U.S., Europe, Africa, Canada, Russia and India
CCI Thermal currently operates from five manufacturing locations within North America
Thermon’s global footprint provides a platform to significantly increase CCI Thermal’s sales internationally
3
Combined Global Footprint that Provides Access to High-
Growth Markets Worldwide

R 226
G 35
B 26
R 255
G 255
B 255
R 00
G 00
B 00
R 239
G 66
B 67
R 199
G 33
B 39
R 154
G 29
B 32
R 207
G 205
B 206
R 160
G 158
B 159
R 70
G 70
B 71
R 15
G 72
B 120
R 21
G 93
B 160
R 58
G 135
B 193
36
Extensive IP portfolio:
─ 17 Canadian patents
─ 8 U.S. patents
─ 10 patent applications pending
7 major globally recognized brands
─ Cata-Dyne, Ruffneck, Norseman, Caloritech, 3L Filters,
Fastrax, DriQuiks
Trade secrets and know-how
─ Non-patented proprietary designs and technological
methods, keeping this competitive information private
─ 20 registered professional engineers
Source: Per CCI management
1 YTD 2017 defined as August 1, 2016 through March 31, 2017; Assumes USD/CAD exchange rate of 1.25 as of 10/10/2017
($k) YTD Mar-2017¹ % YTD Mar-17 Relationship
Customer 1 $2,186 3.9% 10+ years
Customer 2 1,568 2.8% 10+ years
Customer 3 1,193 2.1% 20+ years
Customer 4 990 1.8% 20+ years
Customer 5 960 1.7% 15+ years
Customer 6 884 1.6% 20+ years
Customer 7 819 1.5% 25+ years
Customer 8 692 1.2% 30+ years
Customer 9 593 1.1% 30+ years
Customer 10 536 1.0% 20+ years
Top 10 customers $10,424 18.6%
Strong Financial Track Record
Extensive IP Portfolio and R&D
Tier 1 Player in Highly Fragmented Market
Longstanding Relationships with Diverse Customers
4
CCI Thermal is an attractive addition to the existing Thermon
platform
$84 $81
$93 $97
$68
$76 $77
$26 $23
$32 $34
$13
$18 $18
31% 29%
34%
35%
19%
24%
24%
FY'12 FY'13 FY'14 FY'15 FY'16 FY'17 LTM Aug-17
Revenue Adj EBITDA %Margin
Note: Assumes USD/CAD exchange rate of 1.25 as of 10/10/2017
Vulcanic
11%
CCI Thermal
11%
Watlow
10%
Elmess
9%
Gaumer
Process
8%
Chromalox
8%
DFI
7%
ExHEat
7%
Nibe
4%
Indeeco
4%
Sains
3%
Zoppas
1%
Others
17%

R 226
G 35
B 26
R 255
G 255
B 255
R 00
G 00
B 00
R 239
G 66
B 67
R 199
G 33
B 39
R 154
G 29
B 32
R 207
G 205
B 206
R 160
G 158
B 159
R 70
G 70
B 71
R 15
G 72
B 120
R 21
G 93
B 160
R 58
G 135
B 193
37
Thermon’s Revenue Growth and Consistent Margins Since 2007
15%
30%
45%
60%
75%
$0
$50
$100
$150
$200
$250
$300
$350
2007 2008 2009 2010 2011 2012 2013 2014 2015 2016 2017
Sales Gross Margin % Average Gross Margin % (Since 2000)
Note: Results for fiscal years ended March 31. Gross margin results for fiscal years ended March 31, 2006 and 2011 exclude non-cash purchase accounting adjustments of $7.1 million and $7.6
million related to the Audax and CHS private equity transactions, respectively. The mean gross margin of 45.5% represents historic data since 2000
1 Adjusted for one-time financing cost of $12.9 million associated with the Audax transaction
2 Related to one-time financing costs associated with the CHS Transactions and increased levels of indebtedness incurred in connection with the issuance of $210.0 million of senior secured notes
2007 2008 1 2009 2010 2011 2012 2 2013 2014 2015 2016 2017
LTM June-
17
EBITDA Margin 16.0% 20.9% 23.4% 23.3% 23.9% 26.2% 25.5% 26.8% 27.0% 23.2% 16.4% 16.1%
Free cash flow $7.4 $7.5 $22.5 $22.3 $63.7 $3.6 $39.6 $39.1 $44.0 $38.6 $18.1 $29.5
5 Robust and Consistent Free Cash Flow
R 226
G 35
B 26
R 255
G 255
B 255
R 00
G 00
B 00
R 239
G 66
B 67
R 199
G 33
B 39
R 154
G 29
B 32
R 207
G 205
B 206
R 160
G 158
B 159
R 70
G 70
B 71
R 15
G 72
B 120
R 21
G 93
B 160
R 58
G 135
B 193
38
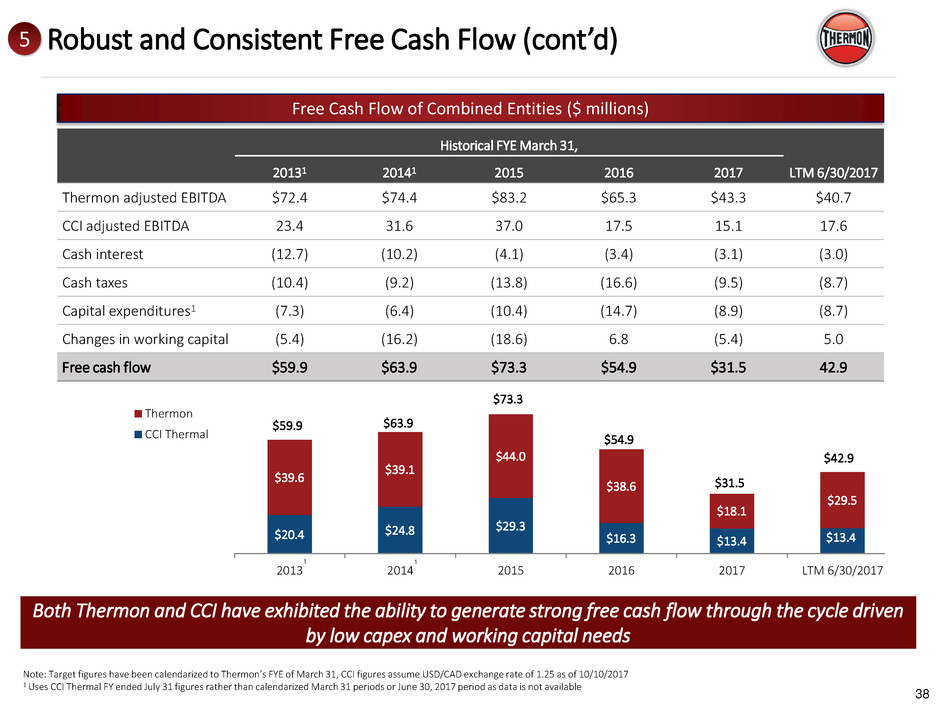
Free Cash Flow of Combined Entities ($ millions)
Both Thermon and CCI have exhibited the ability to generate strong free cash flow through the cycle driven
by low capex and working capital needs
$20.4 $24.8
$29.3
$16.3 $13.4 $13.4
$39.6
$39.1
$44.0
$38.6
$18.1
$29.5
2013 2014 2015 2016 2017 LTM 6/30/2017
Thermon
CCI Thermal
Historical FYE March 31,
LTM 6/30/2017 20131 20141 2015 2016 2017
Thermon adjusted EBITDA $72.4 $74.4 $83.2 $65.3 $43.3 $40.7
CCI adjusted EBITDA 23.4 31.6 37.0 17.5 15.1 17.6
Cash interest (12.7) (10.2) (4.1) (3.4) (3.1) (3.0)
Cash taxes (10.4) (9.2) (13.8) (16.6) (9.5) (8.7)
Capital expenditures1 (7.3) (6.4) (10.4) (14.7) (8.9) (8.7)
Changes in working capital (5.4) (16.2) (18.6) 6.8 (5.4) 5.0
Free cash flow $59.9 $63.9 $73.3 $54.9 $31.5 42.9
Historical FYE March 31,
LTM 6/30/2017 2013 2014 2015 2016 2017
Thermon adjusted EBITDA $72.4 $74.4 $83.2 $65.3 $43.3 $40.7
Cash interest (12.7) (10.1) (4.1) (3.4) (3.1) (3.0)
Cash taxes (10.4) (9.1) (13.7) (15.5) (9.3) (8.5)
Capital expenditures (6.3) (3.4) (6.1) (12.6) (8.4) (8.2)
Changes in working capital (3.4) (12.7) (15.4) 4.8 (6.9) 4.2
Free cash flow $39.6 $39.1 $44.0 $38.7 $15.6 $25.2
Note: Target figures have been calendarized to Thermon’s FYE of March 31, CCI figures assume USD/CAD exchange rate of 1.25 as of 10/10/2017
1 Uses CCI Thermal FY ended July 31 figures rather than calendarized March 31 periods or June 30, 2017 period as data is not available
$59.9 $63.9
$73.3
$54.9
$31.5
$42.9
1 1
5 Robust and Consistent Free Cash Flow (cont’d)
R 226
G 35
B 26
R 255
G 255
B 255
R 00
G 00
B 00
R 239
G 66
B 67
R 199
G 33
B 39
R 154
G 29
B 32
R 207
G 205
B 206
R 160
G 158
B 159
R 70
G 70
B 71
R 15
G 72
B 120
R 21
G 93
B 160
R 58
G 135
B 193
39
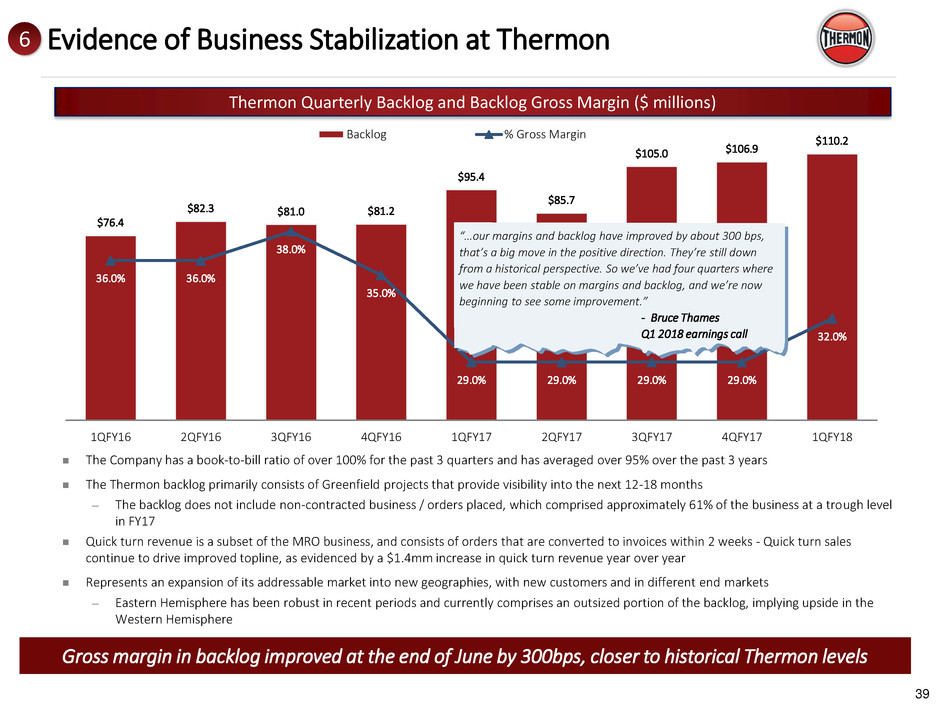
Gross margin in backlog improved at the end of June by 300bps, closer to historical Thermon levels
$76.4
$82.3 $81.0 $81.2
$95.4
$85.7
$105.0 $106.9
$110.2
36.0% 36.0%
38.0%
35.0%
29.0% 29.0% 29.0% 29.0%
32.0%
1QFY16 2QFY16 3QFY16 4QFY16 1QFY17 2QFY17 3QFY17 4QFY17 1QFY18
Backlog % Gross Margin
Thermon Quarterly Backlog and Backlog Gross Margin ($ millions)
The Company has a book-to-bill ratio of over 100% for the past 3 quarters and has averaged over 95% over the past 3 years
The Thermon backlog primarily consists of Greenfield projects that provide visibility into the next 12-18 months
─ The backlog does not include non-contracted business / orders placed, which comprised approximately 61% of the business at a trough level
in FY17
Quick turn revenue is a subset of the MRO business, and consists of orders that are converted to invoices within 2 weeks - Quick turn sales
continue to drive improved topline, as evidenced by a $1.4mm increase in quick turn revenue year over year
Represents an expansion of its addressable market into new geographies, with new customers and in different end markets
─ Eastern Hemisphere has been robust in recent periods and currently comprises an outsized portion of the backlog, implying upside in the
Western Hemisphere
“…our margins and backlog have improved by about 300 bps,
that’s a big move in the positive direction. They’re still down
from a historical perspective. So we’ve had four quarters where
we have been stable on margins and backlog, and we’re now
beginning to see some improvement.”
- Bruce Thames
Q1 2018 earnings call
“This backlog reduced margin has been very consistent from Q1,
Q2, Q3 and Q4 at 29%. So this is kind of the environment that
we have lived with for the last 365 days. And we have not seen
any further erosion in that number since 5 quarters now.”
- Jay Peterson
Q4 2017 earnings call
6 Evidence of Business Stabilization at Thermon
R 226
G 35
B 26
R 255
G 255
B 255
R 00
G 00
B 00
R 239
G 66
B 67
R 199
G 33
B 39
R 154
G 29
B 32
R 207
G 205
B 206
R 160
G 158
B 159
R 70
G 70
B 71
R 15
G 72
B 120
R 21
G 93
B 160
R 58
G 135
B 193
40
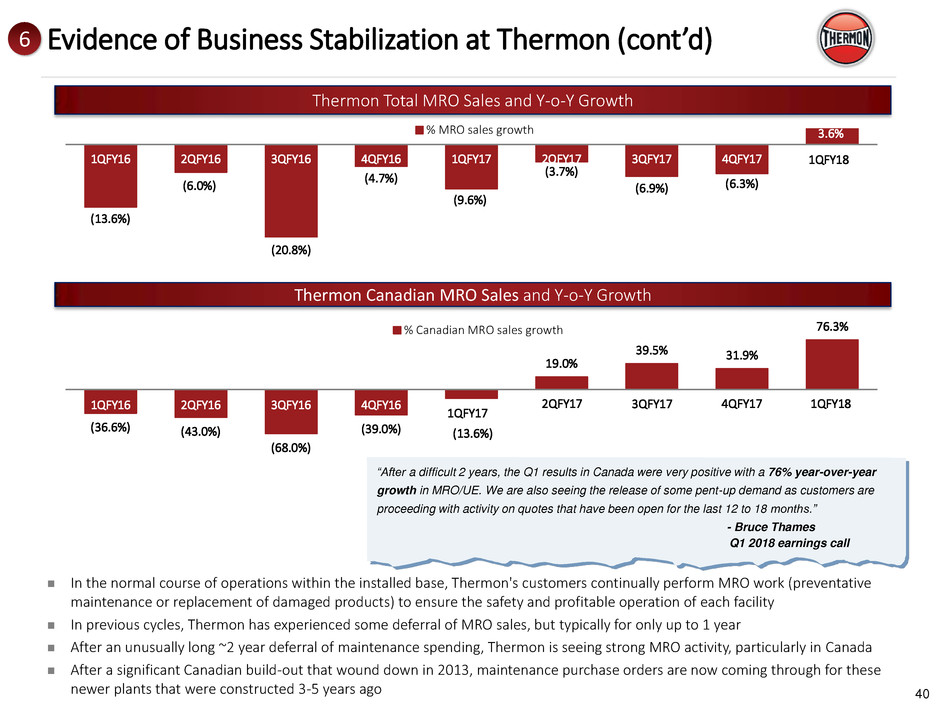
(13.6%)
(6.0%)
(20.8%)
(4.7%)
(9.6%)
(3.7%)
(6.9%) (6.3%)
3.6%
1QFY16 2QFY16 3QFY16 4QFY16 1QFY17 2QFY17 3QFY17 4QFY17 1QFY18
% MRO sales growth
1QFY18
Thermon Total MRO Sales and Y-o-Y Growth
In the normal course of operations within the installed base, Thermon's customers continually perform MRO work (preventative
maintenance or replacement of damaged products) to ensure the safety and profitable operation of each facility
In previous cycles, Thermon has experienced some deferral of MRO sales, but typically for only up to 1 year
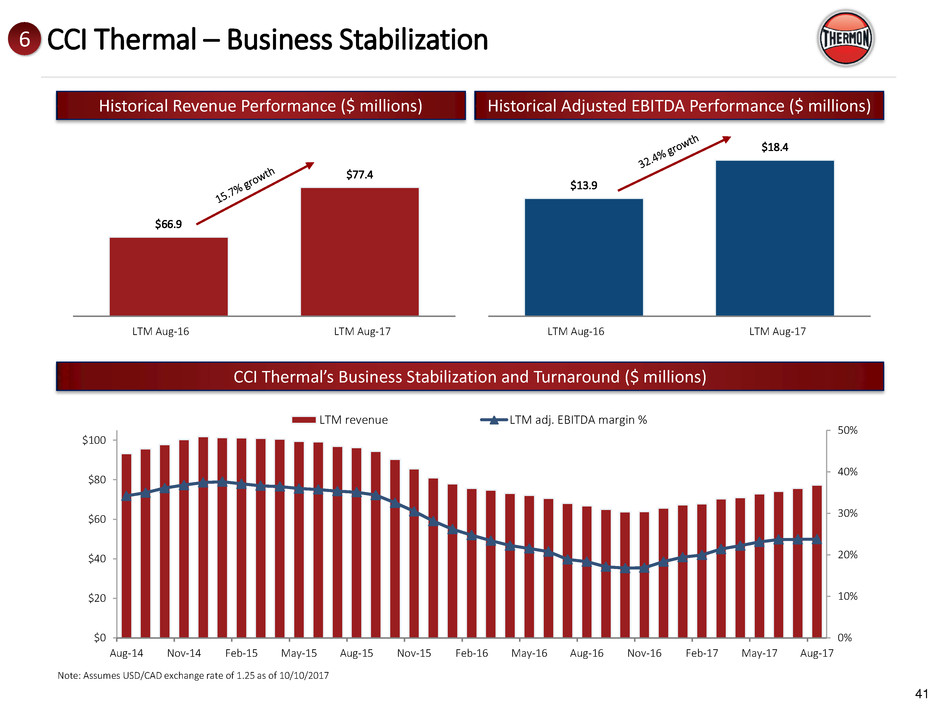
After an unusually long ~2 year deferral of maintenance spending, Thermon is seeing strong MRO activity, particularly in Canada
After a significant Canadian build-out that wound down in 2013, maintenance purchase orders are now coming through for these
newer plants that were constructed 3-5 years ago
“After a difficult 2 years, the Q1 results in Canada were very positive with a 76% year-over-year
growth in MRO/UE. We are also seeing the release of some pent-up demand as customers are
proceeding with activity on quotes that have been open for the last 12 to 18 months.”
- Bruce Thames
Q1 2018 earnings call
Thermon Canadian MRO Sales and Y-o-Y Growth
6 Evidence of Business Stabilization at Thermon (cont’d)
(36.6%) (43.0%)
(68.0%)
(39.0%)
19.0%
39.5% 31.9%
76.3%
1QFY16 2QFY16 3QFY16 4QFY16 1QFY17 2QFY17 3QFY17 4QFY17 1QFY18
% Canadian MRO sales growth
FY1 FY1 FY1 FY1
1QFY17
(13.6%)
R 226
G 35
B 26
R 255
G 255
B 255
R 00
G 00
B 00
R 239
G 66
B 67
R 199
G 33
B 39
R 154
G 29
B 32
R 207
G 205
B 206
R 160
G 158
B 159
R 70
G 70
B 71
R 15
G 72
B 120
R 21
G 93
B 160
R 58
G 135
B 193
41
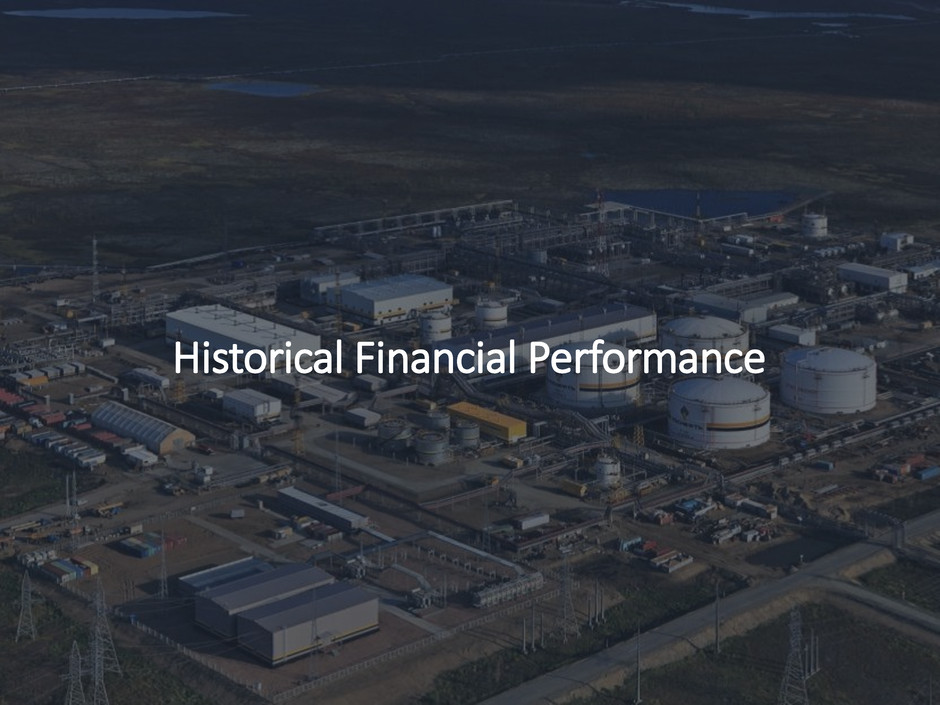
CCI Thermal – Business Stabilization
CCI Thermal’s Business Stabilization and Turnaround ($ millions)
0%
10%
20%
30%
40%
50%
$0
$20
$40
$60
$80
$100
Aug-14 Nov-14 Feb-15 May-15 Aug-15 Nov-15 Feb-16 May-16 Aug-16 Nov-16 Feb-17 May-17 Aug-17
LTM revenue LTM adj. EBITDA margin %
$66.9
$77.4
LTM Aug-16 LTM Aug-17
Historical Revenue Performance ($ millions) Historical Adjusted EBITDA Performance ($ millions)
$13.9
$18.4
LTM Aug-16 LTM Aug-17
6
Note: Assumes USD/CAD exchange rate of 1.25 as of 10/10/2017
R 226
G 35
B 26
R 255
G 255
B 255
R 00
G 00
B 00
R 239
G 66
B 67
R 199
G 33
B 39
R 154
G 29
B 32
R 207
G 205
B 206
R 160
G 158
B 159
R 70
G 70
B 71
R 15
G 72
B 120
R 21
G 93
B 160
R 58
G 135
B 193
42
Historical Financial Performance
R 226
G 35
B 26
R 255
G 255
B 255
R 00
G 00
B 00
R 239
G 66
B 67
R 199
G 33
B 39
R 154
G 29
B 32
R 207
G 205
B 206
R 160
G 158
B 159
R 70
G 70
B 71
R 15
G 72
B 120
R 21
G 93
B 160
R 58
G 135
B 193
43
Financial Strategy Guidelines
Focus on deleveraging with target total net leverage of less than 2.0x
Robust cash flow expected to support debt repayment
Strong backlog, margin recovery, and maintenance capex cycle restart has
created significant potential for growth
Well positioned to benefit from a recovery in the oil & gas markets
No planned shareholder distributions
Grow addressable market via disciplined acquisitions of industrial process
heating manufacturers and service solutions providers with attractive financial
profiles, similar customer bases to Thermon and viable strategic synergies
Target Leverage
Return to Growth
Capital Allocation
R 226
G 35
B 26
R 255
G 255
B 255
R 00
G 00
B 00
R 239
G 66
B 67
R 199
G 33
B 39
R 154
G 29
B 32
R 207
G 205
B 206
R 160
G 158
B 159
R 70
G 70
B 71
R 15
G 72
B 120
R 21
G 93
B 160
R 58
G 135
B 193
44
Thermon – Historical Financial Performance
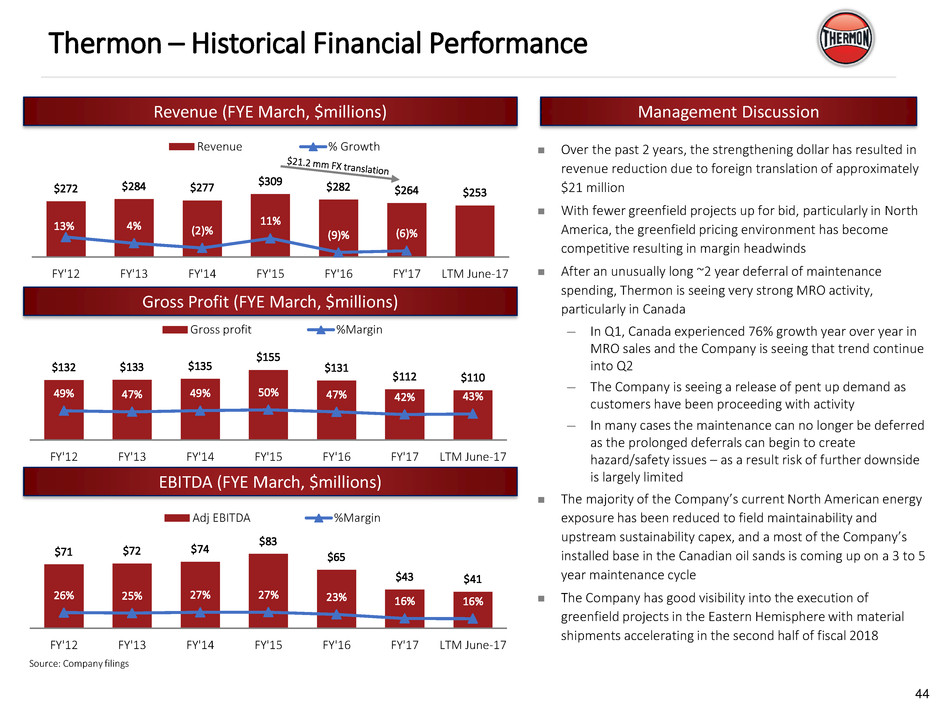
Revenue (FYE March, $millions) Management Discussion
$132 $133 $135
$155
$131
$112 $110
49% 47% 49% 50% 47% 42% 43%
FY'12 FY'13 FY'14 FY'15 FY'16 FY'17 LTM June-17
Gross profit %Margin
Gross Profit (FYE March, $millions)
$272 $284 $277
$309 $282 $264 $253
13% 4% (2)%
11%
(9)% (6)%
FY'12 FY'13 FY'14 FY'15 FY'16 FY'17 LTM June-17
Revenue % Growth
EBITDA (FYE March, $millions)
$71 $72 $74
$83
$65
$43 $41
26% 25% 27% 27% 23% 16% 16%
FY'12 FY'13 FY'14 FY'15 FY'16 FY'17 LTM June-17
Adj EBITDA %Margin
Over the past 2 years, the strengthening dollar has resulted in
revenue reduction due to foreign translation of approximately
$21 million
With fewer greenfield projects up for bid, particularly in North
America, the greenfield pricing environment has become
competitive resulting in margin headwinds
After an unusually long ~2 year deferral of maintenance
spending, Thermon is seeing very strong MRO activity,
particularly in Canada
─ In Q1, Canada experienced 76% growth year over year in
MRO sales and the Company is seeing that trend continue
into Q2
─ The Company is seeing a release of pent up demand as
customers have been proceeding with activity
─ In many cases the maintenance can no longer be deferred
as the prolonged deferrals can begin to create
hazard/safety issues – as a result risk of further downside
is largely limited
The majority of the Company’s current North American energy
exposure has been reduced to field maintainability and
upstream sustainability capex, and a most of the Company’s
installed base in the Canadian oil sands is coming up on a 3 to 5
year maintenance cycle
The Company has good visibility into the execution of
greenfield projects in the Eastern Hemisphere with material
shipments accelerating in the second half of fiscal 2018
Source: Company filings
R 226
G 35
B 26
R 255
G 255
B 255
R 00
G 00
B 00
R 239
G 66
B 67
R 199
G 33
B 39
R 154
G 29
B 32
R 207
G 205
B 206
R 160
G 158
B 159
R 70
G 70
B 71
R 15
G 72
B 120
R 21
G 93
B 160
R 58
G 135
B 193
45
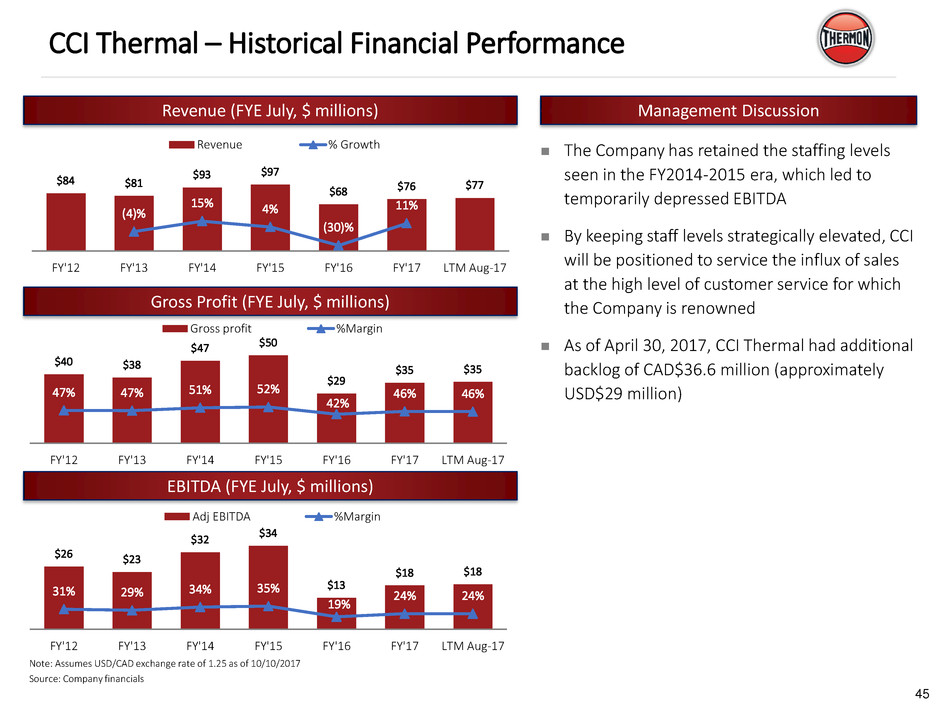
The Company has retained the staffing levels
seen in the FY2014-2015 era, which led to
temporarily depressed EBITDA
By keeping staff levels strategically elevated, CCI
will be positioned to service the influx of sales
at the high level of customer service for which
the Company is renowned
As of April 30, 2017, CCI Thermal had additional
backlog of CAD$36.6 million (approximately
USD$29 million)
Management Discussion
$40 $38
$47 $50
$29
$35 $35
47% 47% 51% 52%
42%
46% 46%
FY'12 FY'13 FY'14 FY'15 FY'16 FY'17 LTM Aug-17
Gross profit %Margin
$26 $23
$32
$34
$13
$18 $18
31% 29% 34% 35%
19%
24% 24%
FY'12 FY'13 FY'14 FY'15 FY'16 FY'17 LTM Aug-17
Adj EBITDA %Margin
$84 $81
$93 $97
$68 $76
$77
(4)%
15% 4%
(30)%
11%
FY'12 FY'13 FY'14 FY'15 FY'16 FY'17 LTM Aug-17
Revenue % Growth
Revenue (FYE July, $ millions)
Gross Profit (FYE July, $ millions)
EBITDA (FYE July, $ millions)
Note: Assumes USD/CAD exchange rate of 1.25 as of 10/10/2017
CCI Thermal – Historical Financial Performance
Source: Company financials
R 226
G 35
B 26
R 255
G 255
B 255
R 00
G 00
B 00
R 239
G 66
B 67
R 199
G 33
B 39
R 154
G 29
B 32
R 207
G 205
B 206
R 160
G 158
B 159
R 70
G 70
B 71
R 15
G 72
B 120
R 21
G 93
B 160
R 58
G 135
B 193
47
Appendix
R 226
G 35
B 26
R 255
G 255
B 255
R 00
G 00
B 00
R 239
G 66
B 67
R 199
G 33
B 39
R 154
G 29
B 32
R 207
G 205
B 206
R 160
G 158
B 159
R 70
G 70
B 71
R 15
G 72
B 120
R 21
G 93
B 160
R 58
G 135
B 193
48
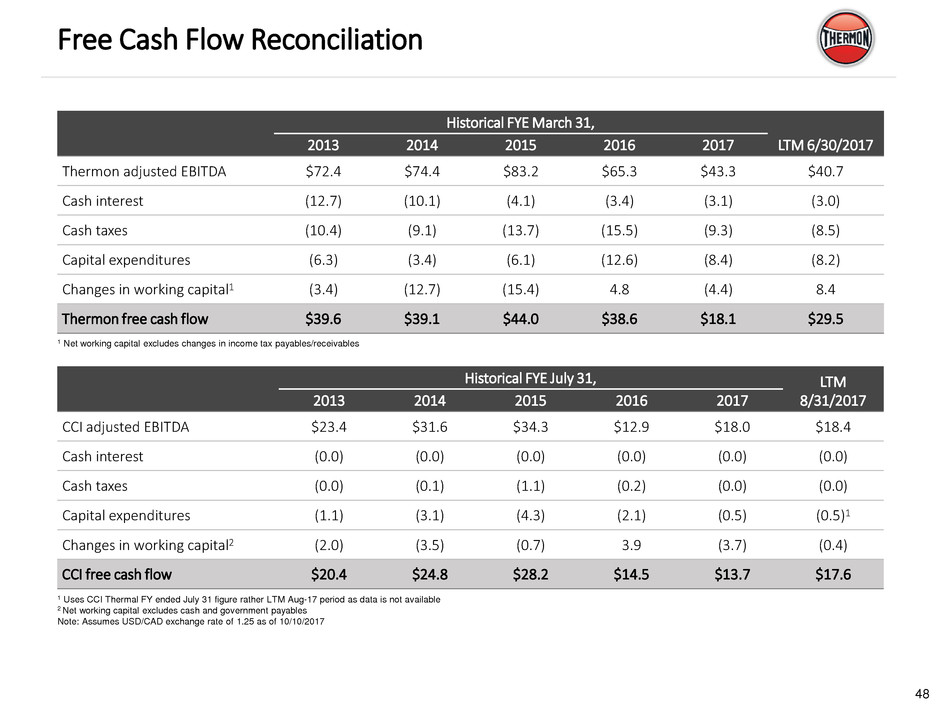
Free Cash Flow Reconciliation
Historical FYE March 31,
LTM 6/30/2017 2013 2014 2015 2016 2017
Thermon adjusted EBITDA $72.4 $74.4 $83.2 $65.3 $43.3 $40.7
Cash interest (12.7) (10.1) (4.1) (3.4) (3.1) (3.0)
Cash taxes (10.4) (9.1) (13.7) (15.5) (9.3) (8.5)
Capital expenditures (6.3) (3.4) (6.1) (12.6) (8.4) (8.2)
Changes in working capital1 (3.4) (12.7) (15.4) 4.8 (4.4) 8.4
Thermon free cash flow $39.6 $39.1 $44.0 $38.6 $18.1 $29.5
Historical FYE July 31, LTM
8/31/2017 2013 2014 2015 2016 2017
CCI adjusted EBITDA $23.4 $31.6 $34.3 $12.9 $18.0 $18.4
Cash interest (0.0) (0.0) (0.0) (0.0) (0.0) (0.0)
Cash taxes (0.0) (0.1) (1.1) (0.2) (0.0) (0.0)
Capital expenditures (1.1) (3.1) (4.3) (2.1) (0.5) (0.5)1
Changes in working capital2 (2.0) (3.5) (0.7) 3.9 (3.7) (0.4)
CCI free cash flow $20.4 $24.8 $28.2 $14.5 $13.7 $17.6
1 Uses CCI Thermal FY ended July 31 figure rather LTM Aug-17 period as data is not available
2 Net working capital excludes cash and government payables
Note: Assumes USD/CAD exchange rate of 1.25 as of 10/10/2017
1 Net working capital excludes changes in income tax payables/receivables
R 226
G 35
B 26
R 255
G 255
B 255
R 00
G 00
B 00
R 239
G 66
B 67
R 199
G 33
B 39
R 154
G 29
B 32
R 207
G 205
B 206
R 160
G 158
B 159
R 70
G 70
B 71
R 15
G 72
B 120
R 21
G 93
B 160
R 58
G 135
B 193
49
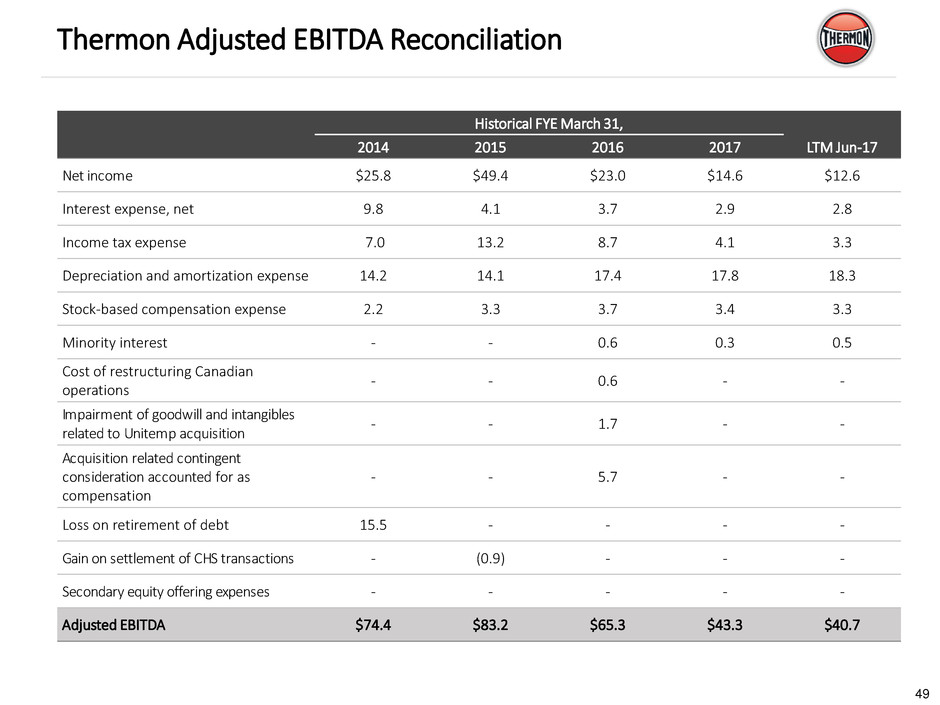
Thermon Adjusted EBITDA Reconciliation
Historical FYE March 31,
LTM Jun-17 2014 2015 2016 2017
Net income $25.8 $49.4 $23.0 $14.6 $12.6
Interest expense, net 9.8 4.1 3.7 2.9 2.8
Income tax expense 7.0 13.2 8.7 4.1 3.3
Depreciation and amortization expense 14.2 14.1 17.4 17.8 18.3
Stock-based compensation expense 2.2 3.3 3.7 3.4 3.3
Minority interest - - 0.6 0.3 0.5
Cost of restructuring Canadian
operations
- - 0.6 - -
Impairment of goodwill and intangibles
related to Unitemp acquisition
- - 1.7 - -
Acquisition related contingent
consideration accounted for as
compensation
- - 5.7 - -
Loss on retirement of debt 15.5 - - - -
Gain on settlement of CHS transactions - (0.9) - - -
Secondary equity offering expenses - - - - -
Adjusted EBITDA $74.4 $83.2 $65.3 $43.3 $40.7
R 226
G 35
B 26
R 255
G 255
B 255
R 00
G 00
B 00
R 239
G 66
B 67
R 199
G 33
B 39
R 154
G 29
B 32
R 207
G 205
B 206
R 160
G 158
B 159
R 70
G 70
B 71
R 15
G 72
B 120
R 21
G 93
B 160
R 58
G 135
B 193
50
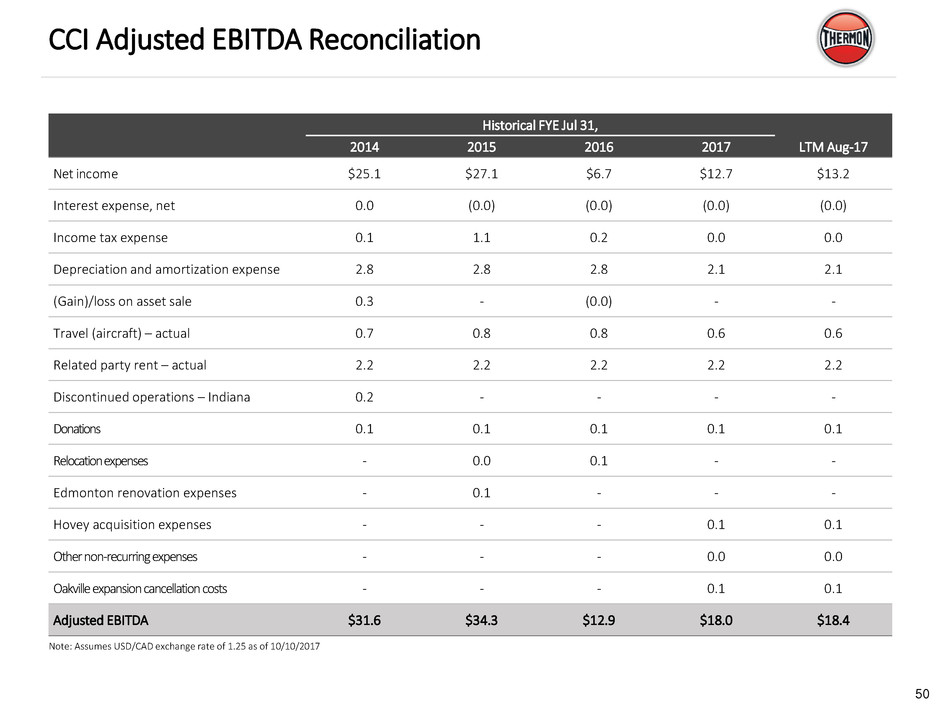
CCI Adjusted EBITDA Reconciliation
Historical FYE Jul 31,
LTM Aug-17 2014 2015 2016 2017
Net income $25.1 $27.1 $6.7 $12.7 $13.2
Interest expense, net 0.0 (0.0) (0.0) (0.0) (0.0)
Income tax expense 0.1 1.1 0.2 0.0 0.0
Depreciation and amortization expense 2.8 2.8 2.8 2.1 2.1
(Gain)/loss on asset sale 0.3 - (0.0) - -
Travel (aircraft) – actual 0.7 0.8 0.8 0.6 0.6
Related party rent – actual 2.2 2.2 2.2 2.2 2.2
Discontinued operations – Indiana 0.2 - - - -
Donations 0.1 0.1 0.1 0.1 0.1
Relocation expenses - 0.0 0.1 - -
Edmonton renovation expenses - 0.1 - - -
Hovey acquisition expenses - - - 0.1 0.1
Other non-recurring expenses - - - 0.0 0.0
Oakville expansion cancellation costs - - - 0.1 0.1
Adjusted EBITDA $31.6 $34.3 $12.9 $18.0 $18.4
Note: Assumes USD/CAD exchange rate of 1.25 as of 10/10/2017
R 226
G 35
B 26
R 255
G 255
B 255
R 00
G 00
B 00
R 239
G 66
B 67
R 199
G 33
B 39
R 154
G 29
B 32
R 207
G 205
B 206
R 160
G 158
B 159
R 70
G 70
B 71
R 15
G 72
B 120
R 21
G 93
B 160
R 58
G 135
B 193
51
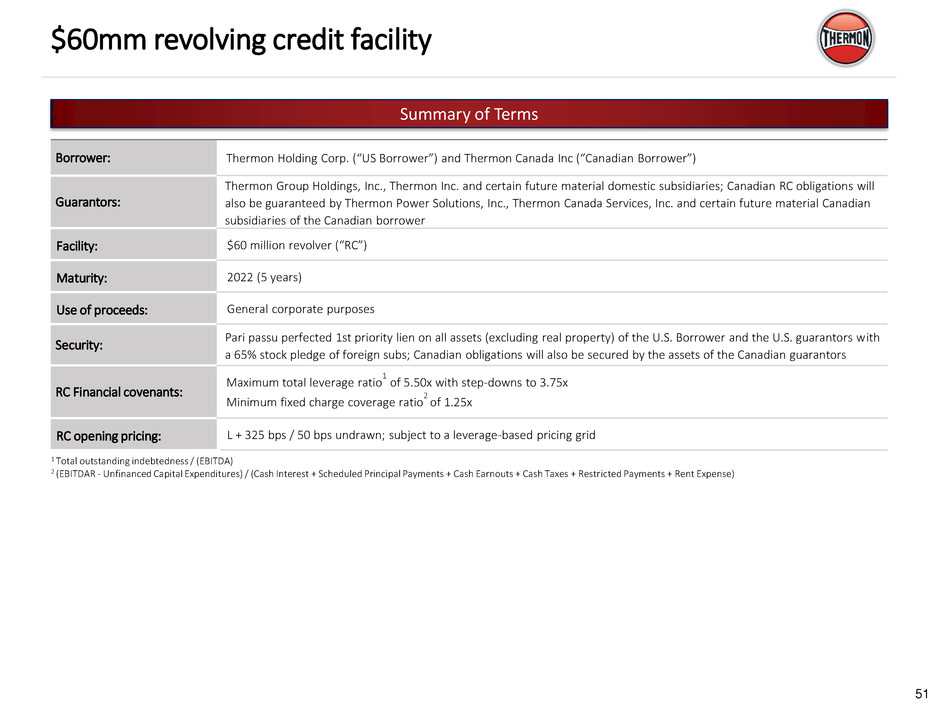
$60mm revolving credit facility
Summary of Terms
1 Total outstanding indebtedness / (EBITDA)
2 (EBITDAR - Unfinanced Capital Expenditures) / (Cash Interest + Scheduled Principal Payments + Cash Earnouts + Cash Taxes + Restricted Payments + Rent Expense)
Borrower: Thermon Holding Corp. (“US Borrower”) and Thermon Canada Inc (“Canadian Borrower”)
Guarantors:
Thermon Group Holdings, Inc., Thermon Inc. and certain future material domestic subsidiaries; Canadian RC obligations will
also be guaranteed by Thermon Power Solutions, Inc., Thermon Canada Services, Inc. and certain future material Canadian
subsidiaries of the Canadian borrower
Facility: $60 million revolver (“RC”)
Maturity: 2022 (5 years)
Use of proceeds: General corporate purposes
Security:
Pari passu perfected 1st priority lien on all assets (excluding real property) of the U.S. Borrower and the U.S. guarantors with
a 65% stock pledge of foreign subs; Canadian obligations will also be secured by the assets of the Canadian guarantors
RC Financial covenants:
Maximum total leverage ratio
1
of 5.50x with step-downs to 3.75x
Minimum fixed charge coverage ratio
2
of 1.25x
RC opening pricing: L + 325 bps / 50 bps undrawn; subject to a leverage-based pricing grid